ZHCSII0A July 2018 – November 2018 ADS1219
PRODUCTION DATA.
- 1 特性
- 2 应用
- 3 说明
- 4 修订历史记录
- 5 Pin Configuration and Functions
- 6 Specifications
- 7 Parameter Measurement Information
- 8 Detailed Description
- 9 Application and Implementation
- 10Power Supply Recommendations
- 11Layout
- 12器件和文档支持
- 13机械、封装和可订购信息
封装选项
机械数据 (封装 | 引脚)
散热焊盘机械数据 (封装 | 引脚)
- RTE|16
订购信息
9.2.3 Application Curve
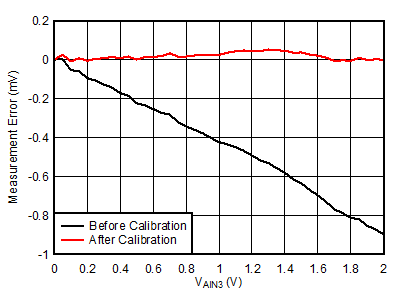
Figure 46 shows the measurement results for the voltage measurement on AIN3. The measurements are taken at TA = 25°C. The black curve shows the measurement error in mV without any offset and gain calibration. The red curve shows the measurement error after offset and gain calibration. The gain calibration removes both the gain error and the error introduced by the initial inaccuracy of the internal voltage reference.
 Figure 46. Measurement Error of Voltage Measurement