at TA = 25°C, 10-bit DAC, and DAC
outputs unloaded (unless otherwise noted)
Figure 7-21 Integral Linearity Error
vs Supply
Voltage Figure 7-23 Total
Unadjusted Error
vs Supply Voltage Figure 7-25 Offset Error vs Supply Voltage Figure 7-27 Full-Scale Error vs Supply Voltage 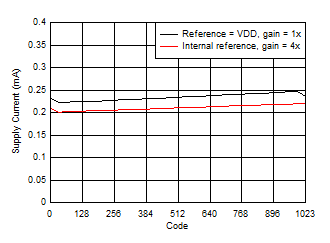 Figure 7-29 Supply Current vs Digital Input Code
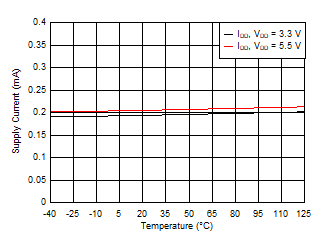
| Internal reference (gain = 4x), DAC at midscale |
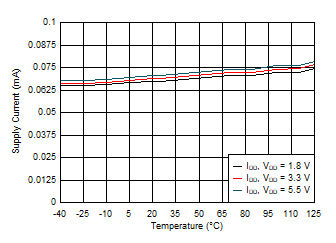
| Reference = VDD, DAC powered down |
Figure 7-33 Power-Down Current vs Temperature
| Reference = VDD = 5.5 V, DAC code transition
from midscale to midscale + 1 LSB, DAC load = 5kΩ ||
200pF |
Figure 7-35 Glitch Impulse, Rising Edge,
1-LSB
Step
| Reference = VDD = 5.5 V, DAC load = 5kΩ ||
200pF |
Figure 7-37 Full-Scale Settling Time, Rising Edge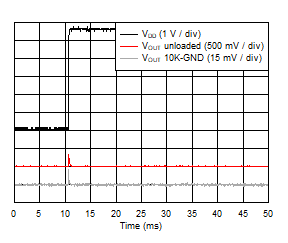 Figure 7-39 Power-on Glitch
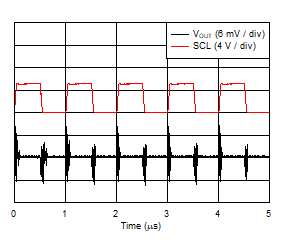
| Reference = VDD = 5.5 V, Fast+ mode, DAC at
midscale, DAC load = 5kΩ || 200pF |
Figure 7-41 Clock
FeedthroughFigure 7-43 DAC
Output Noise Spectral Density
| Reference = VDD = 5.5 V, DAC at
midscale |
Figure 7-45 DAC
Output Noise: 0.1 Hz to 10 HzFigure 7-22 Differential Linearity Error
vs Supply
Voltage Figure 7-24 Zero-Code Error
vs Supply Voltage Figure 7-26 Gain
Error vs Supply Voltage 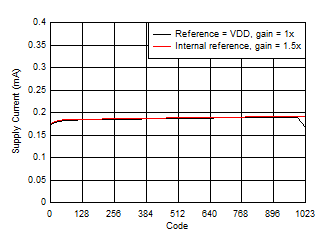 Figure 7-28 Supply Current vs Digital Input Code
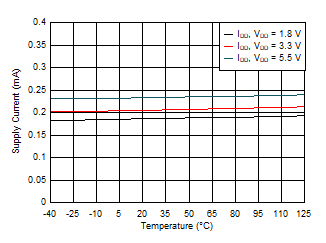
| Reference = VDD, DAC at midscale |
Figure 7-32 Supply Current vs Supply Voltage 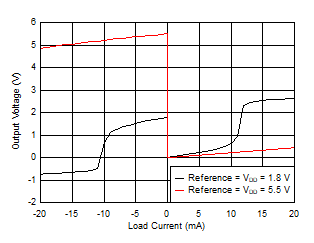 Figure 7-34 Source and Sink Capability
| Reference = VDD = 5.5 V, DAC code transition
from midscale to midscale – 1 LSB, DAC load = 5kΩ ||
200pF |
Figure 7-36 Glitch Impulse, Falling Edge,
1-LSB
Step
| Reference = VDD = 5.5 V, DAC load = 5kΩ ||
200pF |
Figure 7-38 Full-Scale Settling Time, Falling Edge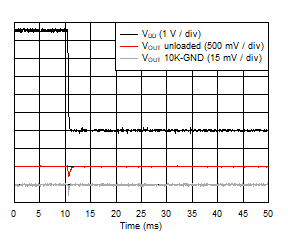 Figure 7-40 Power-off Glitch
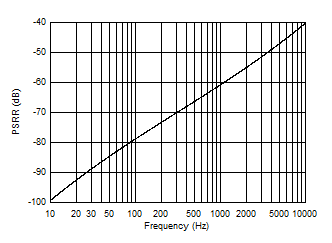
| Internal reference (gain = 4x), VDD = 5.25 V
+ 0.25 VPP, DAC at midscale, DAC load = 5kΩ
|| 200pF |
Figure 7-42 DAC
Output AC PSRR vs Frequency
| Internal reference (gain = 4x), VDD = 5.5
V |
Figure 7-44 DAC
Output Noise Spectral Density
| Internal reference (gain = 4x), VDD = 5.5 V,
DAC at midscale |
Figure 7-46 DAC
Output Noise: 0.1 Hz to 10 Hz


