ZHCSCD7D April 2014 – August 2017 LM43603
PRODUCTION DATA.
- 1 特性
- 2 应用
- 3 说明
- 4 修订历史记录
- 5 Pin Configuration and Functions
- 6 Specifications
-
7 Detailed Description
- 7.1 Overview
- 7.2 Functional Block Diagram
- 7.3
Feature Description
- 7.3.1 Fixed Frequency Peak Current Mode Controlled Step-Down Regulator
- 7.3.2 Light Load Operation
- 7.3.3 Adjustable Output Voltage
- 7.3.4 Enable (EN)
- 7.3.5 VCC, UVLO and BIAS
- 7.3.6 Soft-Start and Voltage Tracking (SS/TRK)
- 7.3.7 Switching Frequency (RT) and Synchronization (SYNC)
- 7.3.8 Minimum ON-time, Minimum OFF-time and Frequency Foldback at Drop-Out Conditions
- 7.3.9 Internal Compensation and CFF
- 7.3.10 Bootstrap Voltage (BOOT)
- 7.3.11 Power Good (PGOOD)
- 7.3.12 Over Current and Short Circuit Protection
- 7.3.13 Thermal Shutdown
- 7.4 Device Functional Modes
-
8 Application and Implementation
- 8.1 Application Information
- 8.2
Typical Applications
- 8.2.1 Design Requirements
- 8.2.2
Detailed Design Procedure
- 8.2.2.1 Custom Design With WEBENCH® Tools
- 8.2.2.2 Output Voltage Set-Point
- 8.2.2.3 Switching Frequency
- 8.2.2.4 Input Capacitors
- 8.2.2.5 Inductor Selection
- 8.2.2.6 Output Capacitor Selection
- 8.2.2.7 Feed-Forward Capacitor
- 8.2.2.8 Bootstrap Capacitors
- 8.2.2.9 VCC Capacitor
- 8.2.2.10 BIAS Capacitors
- 8.2.2.11 Soft-Start Capacitors
- 8.2.2.12 Under Voltage Lockout Set-Point
- 8.2.2.13 PGOOD
- 8.2.3 Application Performance Curves
- 9 Power Supply Recommendations
- 10Layout
- 11器件和文档支持
- 12机械、封装和可订购信息
封装选项
机械数据 (封装 | 引脚)
散热焊盘机械数据 (封装 | 引脚)
- PWP|16
订购信息
6 Specifications
6.1 Absolute Maximum Ratings(1)
over the recommended operating junction temperature (TJ) range of -40°C to +125°C (unless otherwise noted)| PARAMETER | MIN | MAX | UNIT | |
|---|---|---|---|---|
| Input Voltages | VIN to PGND | -0.3 | 42(2) | V |
| EN to PGND | -0.3 | VIN+0.3 | ||
| FB, RT, SS/TRK to AGND | -0.3 | 3.6 | ||
| PGOOD to AGND | -0.3 | 15 | ||
| SYNC to AGND | -0.3 | 5.5 | ||
| BIAS to AGND | -0.3 | 30 or VIN(3) | ||
| AGND to PGND | -0.3 | 0.3 | ||
| Output Voltages | SW to PGND | -0.3 | VIN+0.3 | V |
| SW to PGND less than 10ns Transients | -3.5 | 42 | ||
| CBOOT to SW | -0.3 | 5.5 | ||
| VCC to AGND | -0.3 | 3.6 | ||
| Storage temperature, Tstg | -65 | 150 | °C | |
(1) Stresses beyond those listed under Absolute Maximum Ratings may cause permanent damage to the device. These are stress ratings only, and functional operation of the device at these or any other conditions beyond those indicated under Recommended Operating Conditions is not implied. Exposure to absolute-maximum-rated conditions for extended periods may affect device reliability.
(2) At maximum duty cycle of 0.01%
(3) Whichever is lower
6.2 ESD Ratings
| VALUE | UNIT | |||
|---|---|---|---|---|
| V(ESD) | Electrostatic discharge | Human-body model (HBM), per ANSI/ESDA/JEDEC JS-001(1) | ±1000 | V |
| Charged-device model (CDM), per JEDEC specification JESD22-C101(2) | ±500 | |||
(1) JEDEC document JEP155 states that 500-V HBM allows safe manufacturing with a standard ESD control process.
(2) JEDEC document JEP157 states that 250-V CDM allows safe manufacturing with a standard ESD control process.
6.3 Recommended Operating Conditions(1)
over the recommended operating junction temperature (TJ) range of -40°C to +125°C (unless otherwise noted)| PARAMETER | MIN | MAX | UNIT | |
|---|---|---|---|---|
| Input Voltages | VIN to PGND | 3.5 | 36 | V |
| EN | -0.3 | VIN | ||
| FB | -0.3 | 1.1 | ||
| PGOOD | -0.3 | 12 | ||
| BIAS input not used | -0.3 | 0.3 | ||
| BIAS input used | 3.3 | 28 or VIN (2) | ||
| AGND to PGND | -0.1 | 0.1 | ||
| Output Voltage | VOUT | 1 | 28 | V |
| Output Current | IOUT | 0 | 3 | A |
| Temperature | Operating junction temperature range, TJ | -40 | 125 | °C |
(1) Operating Ratings indicate conditions for which the device is intended to be functional, but do not ensure specific performance limits. For ensured specifications, see Electrical Characteristics.
(2) Whichever is lower.
6.4 Thermal Information
| THERMAL METRIC (1)(2) | HTSSOP (16 PINS) |
VSON (16 PINS) |
UNIT | |
|---|---|---|---|---|
| RθJA | Junction-to-ambient thermal resistance | 38.9(3) | 31.3 | °C/W |
| RθJC (Top) | Junction-to-case (top) thermal resistance | 24.3 | 22.8 | °C/W |
| RθJB | Junction-to-board thermal resistance | 19.9 | 9.6 | °C/W |
| ψJT | Junction-to-top characterization parameter | 0.7 | 0.2 | °C/W |
| ψJB | Junction-to-board characterization parameter | 19.7 | 9.6 | °C/W |
| RθJC(bot) | Junction-to-case (bottom) thermal resistance | 1.7 | 1.3 | °C/W |
(1) The package thermal impedance is calculated in accordance with JESD 51-7;
(2) Thermal Resistances were simulated on a 4 layer, JEDEC board.
(3) See Figure 98 for θJA vs Copper Area Curve
6.5 Electrical Characteristics
Limits apply over the recommended operating junction temperature (TJ) range of -40°C to +125°C, unless otherwise stated. Minimum and Maximum limits are specified through test, design or statistical correlation. Typical values represent the most likely parametric norm at TJ = 25°C, and are provided for reference purposes only. Unless otherwise stated, the following conditions apply: VIN = 12 V, VOUT = 3.3 V, FS = 500 kHz.| PARAMETER | TEST CONDITIONS | MIN | TYP | MAX | UNIT | |
|---|---|---|---|---|---|---|
| SUPPLY VOLTAGE (VIN PIN) | ||||||
| VIN-MIN-ST | Minimum input voltage for startup | 3.8 | V | |||
| ISHDN | Shutdown quiescent current | VEN = 0 V | 1.2 | 3.1 | µA | |
| IQ-NONSW | Operating quiescent current (non-switching) from VIN | VEN = 3.3 V VFB = 1.5 V VBIAS = 3.4 V external |
5.0 | 10 | µA | |
| IBIAS-NONSW | Operating quiescent current (non-switching) from external VBIAS | VEN = 3.3 V VFB = 1.5 V VBIAS = 3.4 V external |
85 | 130 | µA | |
| IQ-SW | Operating quiescent current (switching) | VEN = 3.3 V IOUT = 0 A RT = open VBIAS = VOUT = 3.3 V RFBT = 1 Meg |
27 | µA | ||
| ENABLE (EN PIN) | ||||||
| VEN-VCC-H | Voltage level to enable the internal LDO output VCC | VENABLE high level | 1.2 | V | ||
| VEN-VCC-L | Voltage level to disable the internal LDO output VCC | VENABLE low level | 0.525 | V | ||
| VEN-VOUT-H | Precision enable level for switching and regulator output: VOUT | VENABLE high level | 2 | 2.2 | 2.42 | V |
| VEN-VOUT-HYS | Hysteresis voltage between VOUT precision enable and disable thresholds | VENABLE hysteresis | -290 | mV | ||
| ILKG-EN | Enable input leakage current | VEN = 3.3 V | 0.8 | 1.75 | µA | |
| INTERNAL LDO (VCC and BIAS PINS) | ||||||
| VCC | Internal LDO output voltage VCC | VIN ≥ 3.8 V | 3.28 | V | ||
| VCC-UVLO | Under voltage lock out (UVLO) thresholds for VCC | VCC rising threshold | 3.1 | V | ||
| Hysteresis voltage between rising and falling thresholds | -520 | mV | ||||
| VBIAS-ON | Internal LDO input change over threshold to BIAS | VBIAS rising threshold | 2.94 | 3.15 | V | |
| Hysteresis voltage between rising and falling thresholds | -75 | mV | ||||
| VOLTAGE REFERENCE (FB PIN) | ||||||
| VFB | Feedback voltage | TJ = 25 ºC | 1.004 | 1.011 | 1.018 | V |
| TJ = -40 ºC to 85 ºC | 0.994 | 1.011 | 1.026 | |||
| TJ = -40 ºC to 125 ºC | 0.994 | 1.011 | 1.030 | |||
| ILKG-FB | Input leakage current at FB pin | FB = 1.011 V | 0.2 | 65 | nA | |
| THERMAL SHUTDOWN | ||||||
| TSD (1) | Thermal shutdown | Shutdown threshold | 160 | ºC | ||
| Recovery threshold | 150 | ºC | ||||
| CURRENT LIMIT AND HICCUP | ||||||
| IHS-LIMIT | Peak inductor current limit | 4.4 | 5.5 | 6.4 | A | |
| ILS-LIMIT | Inductor current valley limit | 2.6 | 3 | 3.3 | A | |
| SOFT START (SS/TRK PIN) | ||||||
| ISSC | Soft-start charge current | 1.25 | 2 | 2.75 | µA | |
| RSSD | Soft-start discharge resistance | UVLO, TSD, OCP, or EN = 0 V | 18 | kΩ | ||
| POWER GOOD (PGOOD PIN) | ||||||
| VPGOOD-HIGH | Power-good flag over voltage tripping threshold | % of FB voltage | 110% | 113% | ||
| VPGOOD-LOW | Power-good flag under voltage tripping threshold | % of FB voltage | 77% | 88% | ||
| VPGOOD-HYS | Power-good flag recovery hysteresis | % of FB voltage | 6% | |||
| RPGOOD | PGOOD pin pull down resistance when power bad | VEN = 3.3 V | 69 | 150 | Ω | |
| VEN = 0 V | 150 | 350 | ||||
| MOSFETS (2) | ||||||
| RDS-ON-HS | High-side MOSFET ON-resistance | IOUT = 1 A VBIAS = VOUT = 3.3 V |
120 | mΩ | ||
| RDS-ON-LS | Low-side MOSFET ON-resistance | IOUT = 1 A VBIAS = VOUT = 3.3 V |
65 | mΩ | ||
(1) Ensured by design
(2) Measured at pins
6.6 Timing Requirements
| MIN | TYP | MAX | UNIT | ||
|---|---|---|---|---|---|
| CURRENT LIMIT AND HICCUP | |||||
| NOC | Hiccup wait cycles when LS current limit tripped | 32 | Cycles | ||
| TOC | Hiccup retry delay time | 5.5 | ms | ||
| SOFT START (SS/TRK PIN) | |||||
| TSS | Internal soft-start time when SS pin open circuit | 4.1 | ms | ||
| POWER GOOD (PGOOD PIN) | |||||
| TPGOOD-RISE | Power-good flag rising transition deglitch delay | 220 | µs | ||
| TPGOOD-FALL | Power-good flag falling transition deglitch delay | 220 | µs | ||
6.7 Switching Characteristics
Limits apply over the recommended operating junction temperature (TJ) range of -40°C to +125°C, unless otherwise stated. Minimum and Maximum limits are specified through test, design or statistical correlation. Typical values represent the most likely parametric norm at TJ = 25°C, and are provided for reference purposes only. Unless otherwise stated, the following conditions apply: VIN = 12 V, VOUT = 3.3 V, FS = 500 kHz.| PARAMETER | TEST CONDITIONS | MIN | TYP | MAX | UNIT | |
|---|---|---|---|---|---|---|
| SW (SW PIN) | ||||||
| tON-MIN(1) | Minimum high side MOSFET ON time | 125 | 165 | ns | ||
| tOFF-MIN(1) | Minimum high side MOSFET OFF time | 200 | 250 | ns | ||
| OSCILLATOR (SW and SYNC PINS) | ||||||
| FOSC-DEFAULT | Oscillator default frequency | RT pin open circuit | 425 | 500 | 580 | kHz |
| FADJ | Minimum adjustable frequency | With 1% resistors at RT pin | 200 | kHz | ||
| Maximum adjustable frequency | 2200 | kHz | ||||
| Frequency adjust accuracy | 10% | |||||
| VSYNC-HIGH | Sync clock high level threshold | 2 | V | |||
| VSYNC-LOW | Sync clock low level threshold | 0.4 | V | |||
| DSYNC-MAX | Sync clock maximum duty cycle | 90% | ||||
| DSYNC-MIN | Sync clock minimum duty cycle | 10% | ||||
| TSYNC-MIN | Mininum sync clock ON and OFF time | 80 | ns | |||
(1) Ensured by design
6.8 Typical Characteristics
Unless otherwise specified, VIN = 12 V, VOUT = 3.3 V, FS = 500 kHz, L = 6.8 µH, COUT = 120 µF, CFF = 100 pF. Please refer to Application Performance Curves for Bill of materials for other VOUT and FS combinations.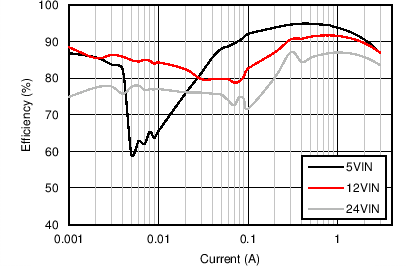
| VOUT = 3.3 V | FS = 500 kHz |
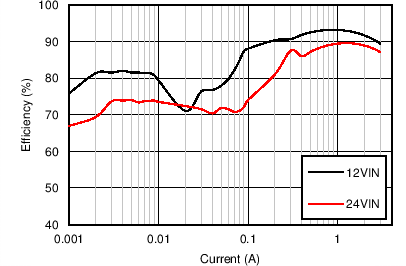
| VOUT = 5 V | FS = 500 kHz |
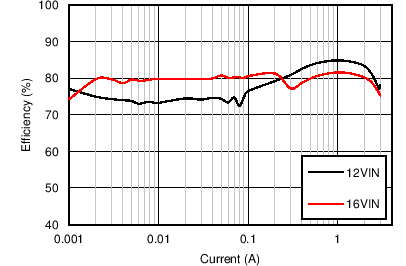
| VOUT = 5 V | FS = 2.2 MHz |
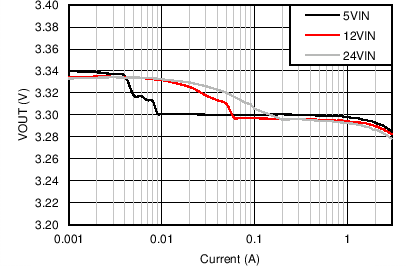
| VOUT = 3.3 V | FS = 500 kHz |
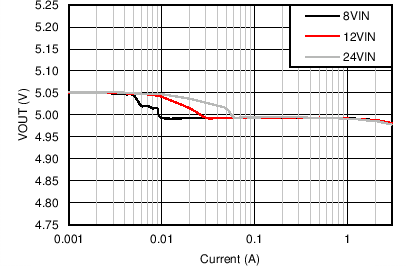
| VOUT = 5V | FS = 500 kHz |
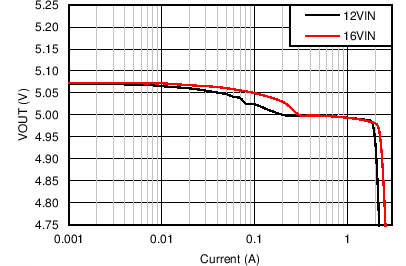
| VOUT = 5 V | FS = 2.2 MHz |
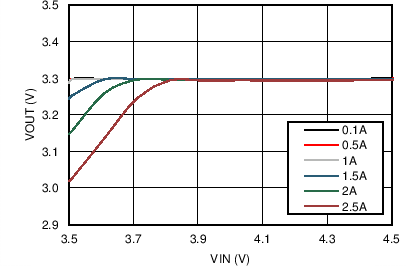
| VOUT = 3.3 V | FS = 500 kHz |
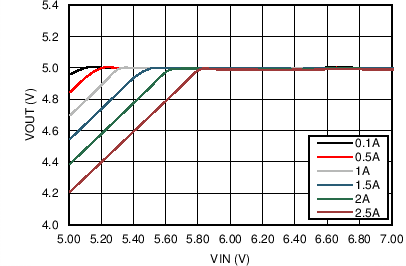
| VOUT = 5 V | FS = 500 kHz |
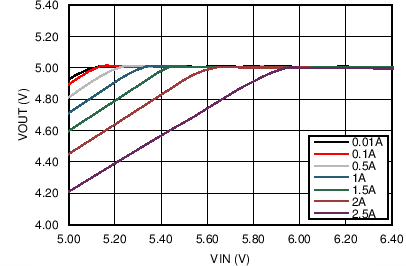
| VOUT = 5 V | FS = 2.2 MHz |
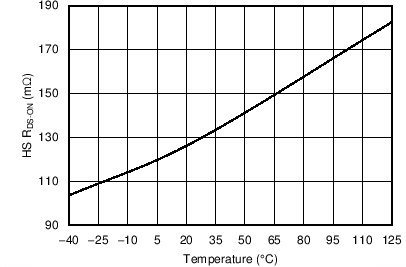 Figure 23. High-Side FET On Resistance vs Junction Temperature
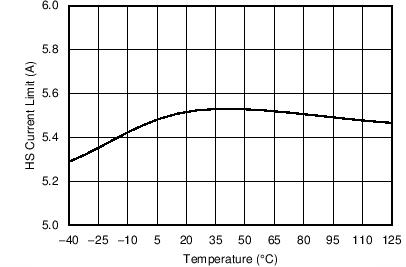 Figure 25. High-Side Current Limit vs Junction Temperature
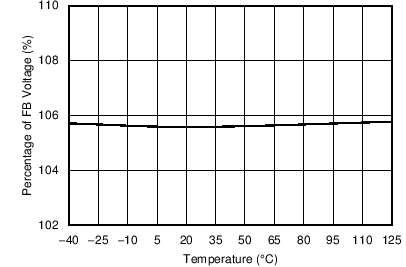 Figure 27. PGOOD OVP Falling Threshold vs Junction Temperature
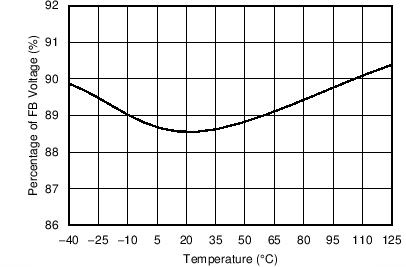 Figure 29. PGOOD UVP Falling Threshold vs Junction Temperature
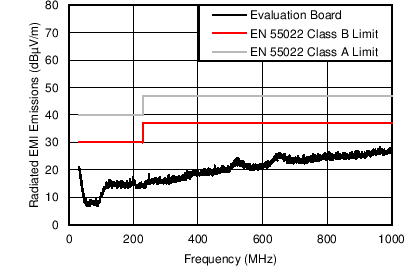
| VOUT = 3.3 V | FS = 500 kHz | IOUT = 3 A |
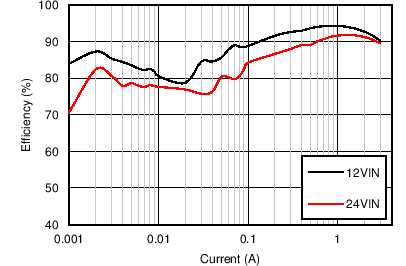
| VOUT = 5 V | FS = 200 kHz |
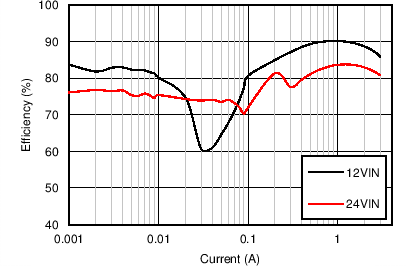
| VOUT = 5 V | FS = 1 MHz |
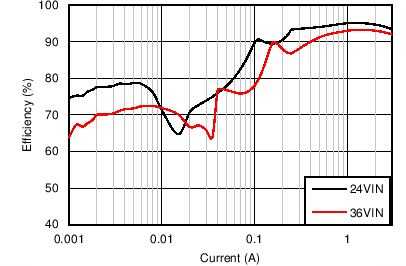
| VOUT = 12 V | FS = 500 kHz |
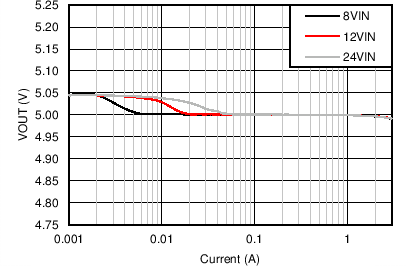
| VOUT = 5 V | FS = 200 kHz |
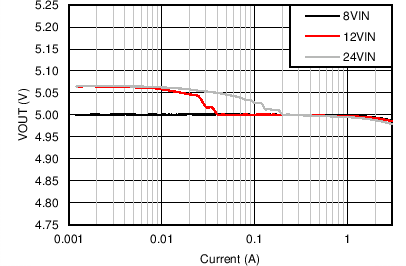
| VOUT = 5 V | FS = 1 MHz |
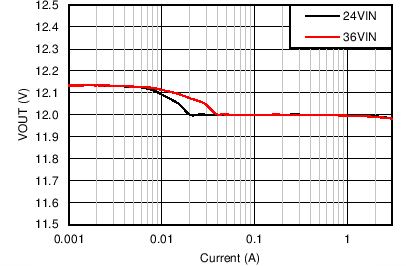
| VOUT = 12 V | FS = 500 kHz |
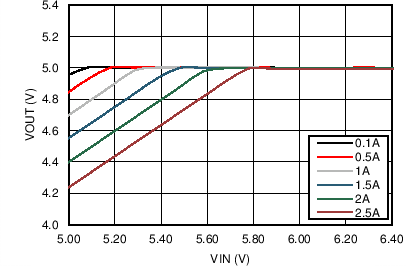
| VOUT = 5 V | FS = 200 kHz |
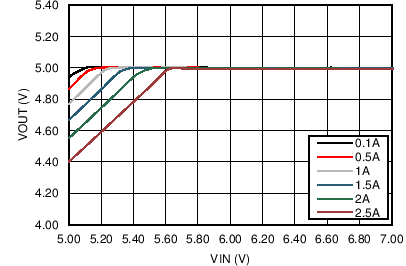
| VOUT = 5 V | FS = 1 MHz |
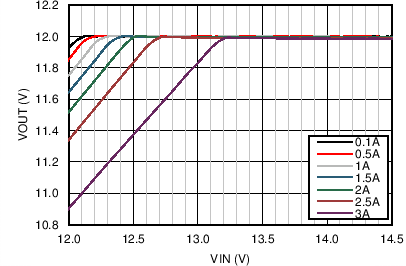
| VOUT = 12 V | FS = 500 kHz |
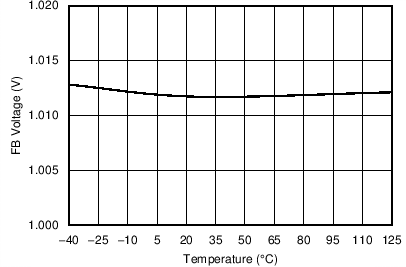 Figure 22. FB Voltage vs Junction Temperature
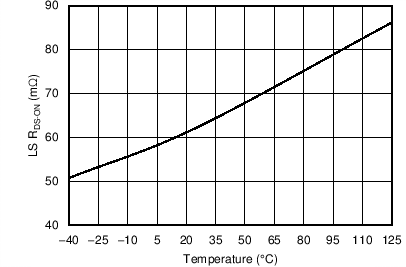 Figure 24. Low-Side FET On Resistance vs Junction Temperature
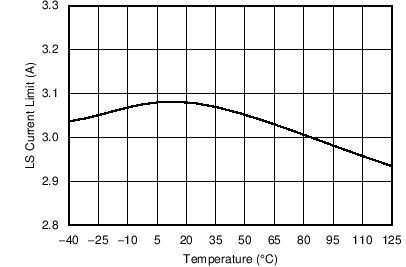 Figure 26. Low-Side Current Limit vs Junction Temperature
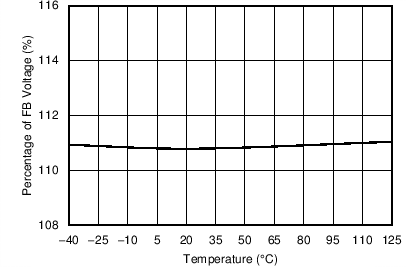 Figure 28. PGOOD OVP Rising Threshold vs Junction Temperature
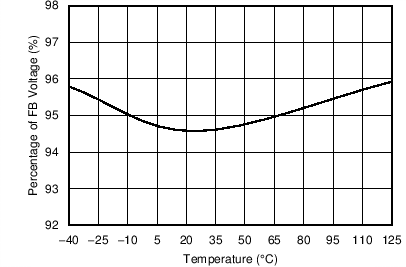 Figure 30. PGOOD UVP Rising Threshold vs Junction Temperature
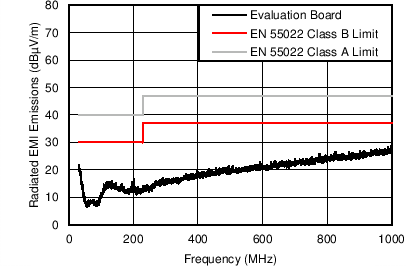
| VOUT = 5 V | FS = 500 kHz | IOUT = 3 A |
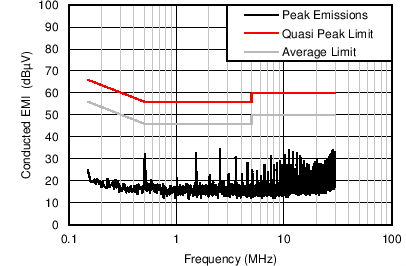
| VOUT = 5V | FS = 500 kHz | IOUT = 3 A |
| Cd = 47 µF | Lin = 1 µH | CIN4 = 68 µF |
