ZHCS618B December 2011 – December 2016 OPA1652 , OPA1654
PRODUCTION DATA.
- 1 特性
- 2 应用
- 3 说明
- 4 修订历史记录
- 5 Pin Configuration and Functions
- 6 Specifications
- 7 Detailed Description
- 8 Application and Implementation
- 9 Power Supply Recommendations
- 10Layout
- 11器件和文档支持
- 12机械、封装和可订购信息
封装选项
机械数据 (封装 | 引脚)
散热焊盘机械数据 (封装 | 引脚)
- DRG|8
订购信息
8 Application and Implementation
NOTE
Information in the following applications sections is not part of the TI component specification, and TI does not warrant its accuracy or completeness. TI’s customers are responsible for determining suitability of components for their purposes. Customers should validate and test their design implementation to confirm system functionality.
8.1 Application Information
8.1.1 Noise Performance
Figure 38 shows the total circuit noise for varying source impedances with the op amp in a unity-gain configuration (no feedback resistor network, and therefore no additional noise contributions).
The OPA165x ( Gain bandwidth = 18 MHz, G = 1) is shown with total circuit noise calculated. The op amp contributes a voltage noise component and a current noise component. The voltage noise is commonly modeled as a time-varying component of the offset voltage. The current noise is modeled as the time-varying component of the input bias current, and reacts with the source resistance to create a voltage component of noise. Therefore, the lowest noise op amp for a given application depends on the source impedance. For low source impedance, current noise is negligible, and voltage noise typically dominates the total noise of the circuit. The voltage noise of the OPA165x series op amps makes the series a suitable choice for source impedances greater than or equal to 1-kΩ.
The equation in Figure 38 shows the calculation of the total circuit noise, with these parameters:
- en = Voltage noise
- in = Current noise
- RS = Source impedance
- k = Boltzmann’s constant = 1.38 × 10⁻²³ J/K
- T = Temperature in Kelvins (K)
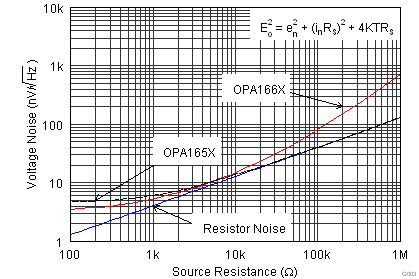 Figure 38. Noise Performance of the OPA165x in Unity-Gain Buffer Configuration
Design of low-noise op amp circuits requires careful consideration of a variety of possible noise contributors: noise from the signal source, noise generated in the op amp, and noise from the feedback network resistors. The total noise of the circuit is the root-sum-square combination of all noise components.
The resistive portion of the source impedance produces thermal noise proportional to the square root of the resistance. Figure 38 plots this equation. The source impedance is typically fixed; consequently, select the op amp and the feedback resistors to minimize the respective contributions to the total noise.
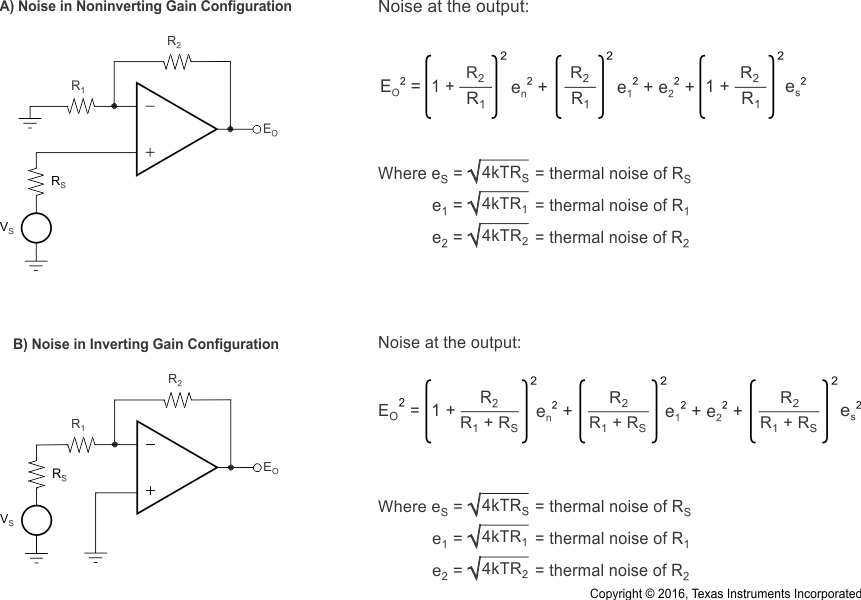
Figure 39 illustrates both inverting (Figure 39 B) and noninverting (Figure 39 A) op amp circuit configurations with gain. In circuit configurations with gain, the feedback network resistors contribute noise. The current noise of the op amp reacts with the feedback resistors, creating additional noise components. The feedback resistor values can generally be selected to make these noise sources negligible. The equations for total noise are shown for both configurations.
NOTE:
For the OPA165x series of op amps at 1 kHz, en = 4.5 nV/√Hz.8.1.2 Total Harmonic Distortion Measurements
The OPA165x series op amps have excellent distortion characteristics. THD + noise is below 0.0002% (G = 1, VO = 3 VRMS, bandwidth = 80 kHz) throughout the audio frequency range, 20 Hz to 20 kHz, with a 2-kΩ load (see Figure 7 for characteristic performance).
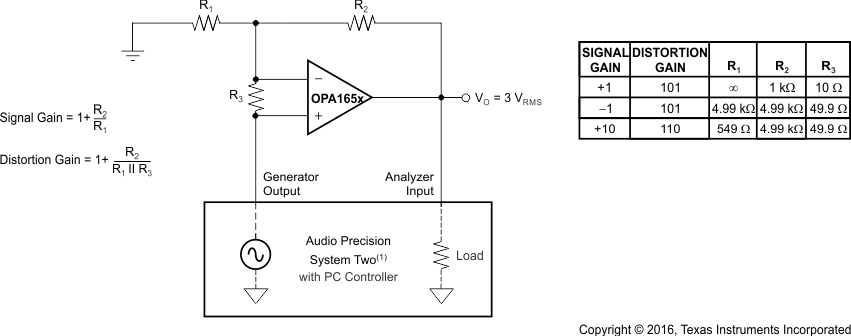
The distortion produced by the OPA165x series op amps is below the measurement limit of many commercially available distortion analyzers. However, a special test circuit (such as Figure 40 shows) can extend the measurement capabilities.
Op amp distortion can be considered an internal error source that refers to the input. Figure 40 shows a circuit that causes the op amp distortion to be gained up (refer to the table in Figure 40 for the distortion gain factor for various signal gains). The addition of R3 to the otherwise standard noninverting amplifier, configuration alters the feedback factor or noise gain of the circuit. The closed-loop gain is unchanged, but the distortion gain factor reduces the feedback available for error connection, that extends the resolution by the same amount. Note that the input signal and load applied to the op amp are the same as with conventional feedback without R3. The value of R3 must be kept small to minimize the effect on the distortion measurements.
The validity of this technique can be verified by duplicating measurements at high gain or high frequency where the distortion is within the measurement capability of the test equipment. The Audio Precision System Two distortion and noise analyzer calculated the measurements for this data sheet, which significantly simplifies repetitive measurements. Manual distortion measurement instruments performs this measurement technique.
8.1.3 Capacitive Loads
The dynamic characteristics of the OPA1652 and OPA1654 are optimized for commonly encountered gains, loads, and operating conditions. The combination of low closed-loop gain and high capacitive loads decreases the phase margin of the amplifier and can lead to gain peaking or oscillations. As a result, heavier capacitive loads must be isolated from the output. The simplest way to achieve this isolation is to add a small resistor (RS equal to 50 Ω, for example) in series with the output.
This small series resistor also prevents excess power dissipation if the output of the device becomes shorted. Figure 19 illustrates a graph of Small-Signal Overshoot vs Capacitive Load for several values of RS. For more details about analysis techniques and application circuits, see Feedback Plots Define Op Amp AC Performance (SBOA015), available for download from the TI website (www.ti.com).
8.2 Typical Application
The low noise and distortion of the OPA165x family of audio operational amplifiers make them an excellent choice for a number of analog audio circuits. Figure 41 illustrates a power amplifier circuit suitable for high-fidelity headphone applications.
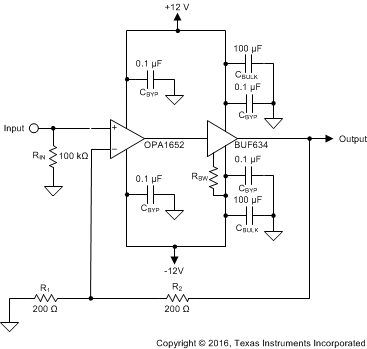 Figure 41. Composite Power Amplifier for Headphones
8.2.1 Design Requirements
- Gain: 6 dB
- Output Voltage: > 2 VRMS, 32-Ω Load
- Output Impedance: < 1 Ω
- THD+N: < –110dB (1 kHz, 2 VRMS, 32-Ω Load)
8.2.2 Detailed Design Procedure
The power amplifier circuit (single channel shown) features a BUF634 high-speed buffer amplifier inside the feedback loop of an OPA1652 to increase the amount of available output current. The bandwidth and power consumption of the BUF634 can be set with an external resistor (RBW). For this circuit, RBW uses a 0-Ω resistor that configures the BUF634 for the widest bandwidth and highest performance. Feedback resistors R1 and R2 (as shown in Equation 1) calculate the gain of the circuit:

To achieve the design goal of a 6-dB voltage gain (2 V/V), R1 and R2 must have equal values. These resistors also contribute noise thermal noise to the circuit. The voltage noise spectral density of the feedback resistors, referred to the amplifier input, is given in Equation 2:

Ideally, the thermal noise contributions of the resistors do not significantly degrade the noise performance of the circuit. Selecting resistor values so the resistor noise is less than one-third the input voltage noise of the op amp (Equation 3) ensures that any increase in the circuit noise as a result of the feedback resistor contributions is minimal.

To calculate the required resistor values, Equation 3 is inserted into Equation 2, and the resulting equation is rearranged to solve for the parallel combination of R1 and R2 , as shown in Equation 4. Using a value of 3.8 nV/√Hz as the broadband voltage noise of the OPA1652 results in a value of 96.8 Ω for the parallel combination of R1 and R2. R1 and R2 use standard value 200-Ω resistors, resulting in a parallel value of 100 Ω, which is suitably close to the required value.

Because of the extremely wide bandwidth and high slew rate of the BUF634, no additional components are required to maintain stability in the circuit or prevent latch-up conditions. This circuit is stable with capacitive loads over 1-nF, which is suitable for headphone applications.
8.2.3 Application Curves
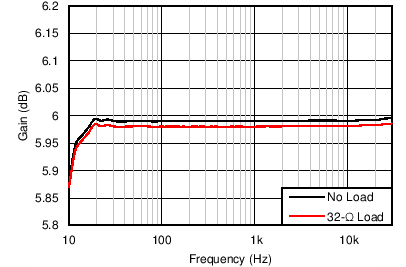
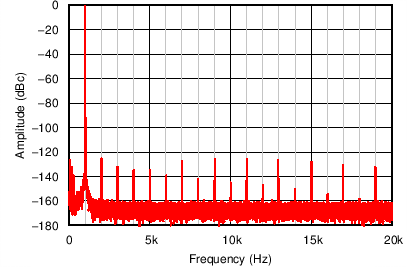
The measured performance of the circuit is shown in Figure 42 through Figure 46. The frequency response is extremely flat over the full audio bandwidth, deviating only 0.004 dB over the audible range. The decrease in gain shown at low frequency is a result of the test equipment, and not the amplifier circuit. The amplifier output impedance, calculated from the change in gain in the loaded and unloaded conditions, is 0.036 Ω. The maximum output power (before clipping) is displayed in Figure 43. For a 32-Ω load, the power amplifier delivered 781 mW before clipping. The best THD+N performance achieved with a 32-Ω load was –117.2 dB at 678 mW (1 kHz, 22-kHz measurement bandwidth). THD+N vs frequency is shown in Figure 44 for a 2-VRMS output level measured in a 90-kHz bandwidth. The worst-case measurement was for a 16-Ω load (250 mW), 20-kHz input frequency, –91.8 dB (0.0026%). The amplifier output spectrum for a 2-VRMS, 1 kHz, fundamental into two different loads is shown in Figure 45 and Figure 46. All distortion harmonics are below –120 dB relative to the fundamental for both loading conditions.
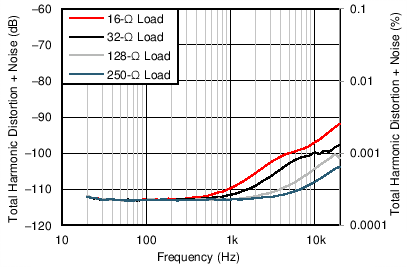
| 90-kHz measurement bandwidth, 2-VRMS output |
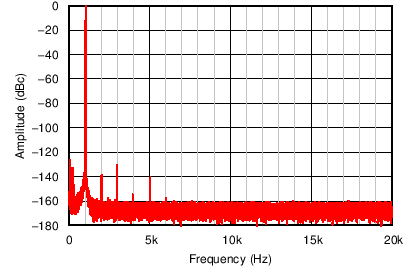
| 1 kHz, 250-Ω load, 2 VRMS |
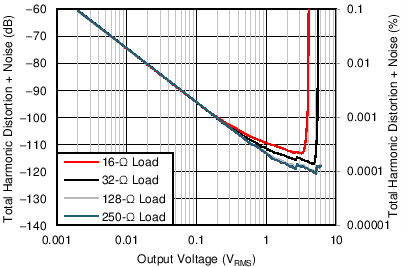
| 22-kHz measurement bandwidth, 1-kHz output |
| 1 kHz, 32-Ω load, 2-VRMS output |
