ZHCSE82B June 2015 – October 2015 OPT8241
PRODUCTION DATA.
- 1 特性
- 2 应用
- 3 说明
- 4 修订历史记录
- 5 Pin Configuration and Functions
- 6 Specifications
- 7 Detailed Description
- 8 Application and Implementation
- 9 Power Supply Recommendations
- 10Layout
- 11器件和文档支持
- 12机械、封装和可订购信息
8 Application and Implementation
NOTE
Information in the following applications sections is not part of the TI component specification, and TI does not warrant its accuracy or completeness. TI’s customers are responsible for determining suitability of components for their purposes. Customers should validate and test their design implementation to confirm system functionality.
8.1 Application Information
ToF cameras provide the complete depth map of a scene. In contrast with the scanning type light detection and ranging (LIDAR) systems, the depth map of the entire scene is captured at the same instant with an array of ToF pixels. A broad classification of applications for a 3D camera include:
- Presence detection,
- Object location,
- Movement detection, and
- 3D scanning.
The OPT8241 ToF sensor, along with TI's OPT9221 ToF controller, forms a two-chip solution for creating a 3D camera. The block diagram of a complete 3D ToF camera implementation using the OPT8241 is shown in Figure 8.
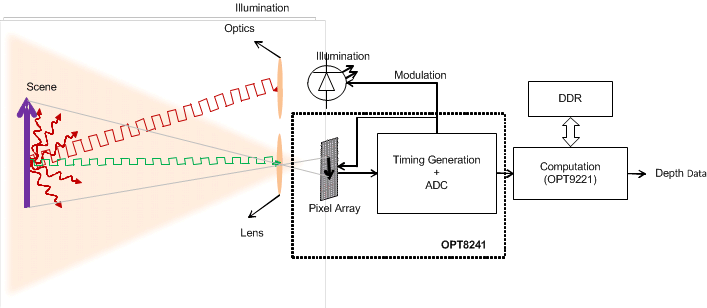 Figure 8. 3D ToF Camera
The TI ToF estimator tool can be used to estimate the performance of a ToF camera with various configurations. The estimator allows control of the following parameters:
- Depth resolution
- 2D resolution (number of pixels)
- Distance range
- Frame rate
- Field of view (FoV)
- Ambient light (in watts × nm × m2 around the sensor filter bandwidth)
- Reflectivity of the objects
8.2 Typical Applications
8.2.1 Presence Detection for Industrial Safety
Processing 3D information and a separate foreground from the background is computationally less intensive when compared to using color information from a reg, green, blue (RGB) camera. 3D information can also be used to extract the form of the object and classify the object detected as being a human, robot, vehicle, and so forth, as shown in Figure 9.
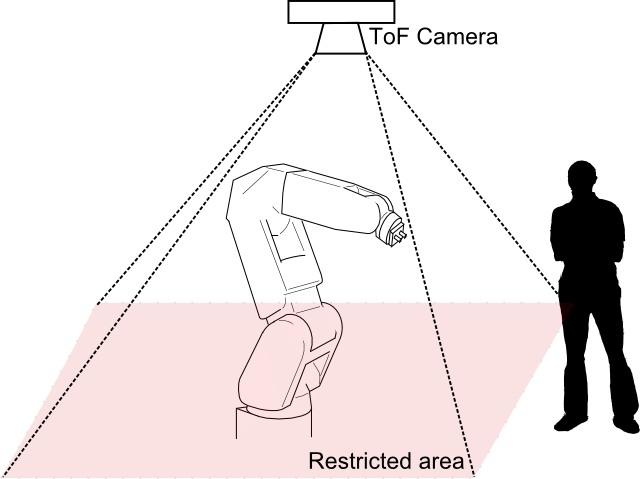 Figure 9. Industrial Safety
8.2.1.1 Design Requirements
Table 3. Industrial Safety Requirements
| SPECIFICATION | VALUE | UNITS | COMMENTS |
|---|---|---|---|
| Depth resolution | 7.5 | Percentage of distance | Temporal standard deviation of measured distance without the use of any software filters |
| Frame rate | 30 | Frames per second | For reactions fast enough to trigger a machine shut down |
| Field of view | 74.4 × 59.3 | Degrees (H × V) | Example only, requirements may vary |
| Minimum distance | 1 | Meters | Example only, requirements may vary |
| Maximum distance | 5 | Meters | Example only, requirements may vary |
| Minimum reflectivity of objects at which the depth resolution is specified | 40 | Percentage | Assuming Lambertian reflection |
| Number of pixels | 320 × 240 | Rows x columns | Using a full array |
| Ambient light | 0.1 | W × nm × m2 around 850 nm | Low-intensity diffused sunlight |
| Illumination source | Laser | — | Laser + diffuser for diffusing light uniformly through the scene |
8.2.1.2 Detailed Design Procedure
Using the TI ToF estimator tool, the ToF camera design requirements can be input and the power numbers required for achieving the desired specifications can be obtained. The choice of inputs to the estimator tool is explained in the following section.
8.2.1.2.1 Frequencies of Operation
The frequencies of operation are limited by the sensor bandwidth because the illumination source is a laser. Frequencies around 75 MHz can be used to obtain a good demodulation figure of merit. Two frequencies are used to implement de-aliasing and extend the unambiguous range because frequencies around 75 MHz provide a very short unambiguous range. The two frequencies chosen for de-aliasing are 70 MHz and 80 MHz. The unambiguous range is now given by Equation 1.

For the purpose of power requirement calculations, the average frequency of 75 MHz can be used in the estimator tool.
8.2.1.2.2 Number of Sub-Frames and Quads
In this example, two sub-frames and six quads are used to obtain good dynamic range and account for wide ranges of reflectivity and distance. Also, six quads (minimum) are required for implementing de-aliasing. A depth resolution of 5% instead of the requirement of 7.5% is used as the resolution input to the estimator tool to allow for margins resulting from the additional noise when using de-aliasing.
8.2.1.2.3 Field of View (FoV)
Field of view in the horizontal direction is 74.4 degrees. The diagonal FoV can be calculated using Equation 2.

The ratio of 5/4 is used to represent the ratio of the diagonal length to the horizontal length of the sensor.
8.2.1.2.4 Lens
A lens with a 1/3” image circle must be chosen. The FoV of the lens must match the requirements (that is, the FoV must be equal to 87 degrees, as calculated in Equation 2). A lower f.no is always better. For this example, use an f.no of 1.2.
8.2.1.2.5 Integration Duty Cycle
An integration duty cycle of less than 50% is chosen to keep the sensor cool in an industrial housing with no airflow. Choosing an even lower integration duty cycle can result in a marked increase in the peak illumination power. Higher peak illumination power results in a higher number of illumination elements and, thus, an increase in system cost.
8.2.1.2.6 Design Summary
A screen shot of the system estimator tool is shown in Figure 10.
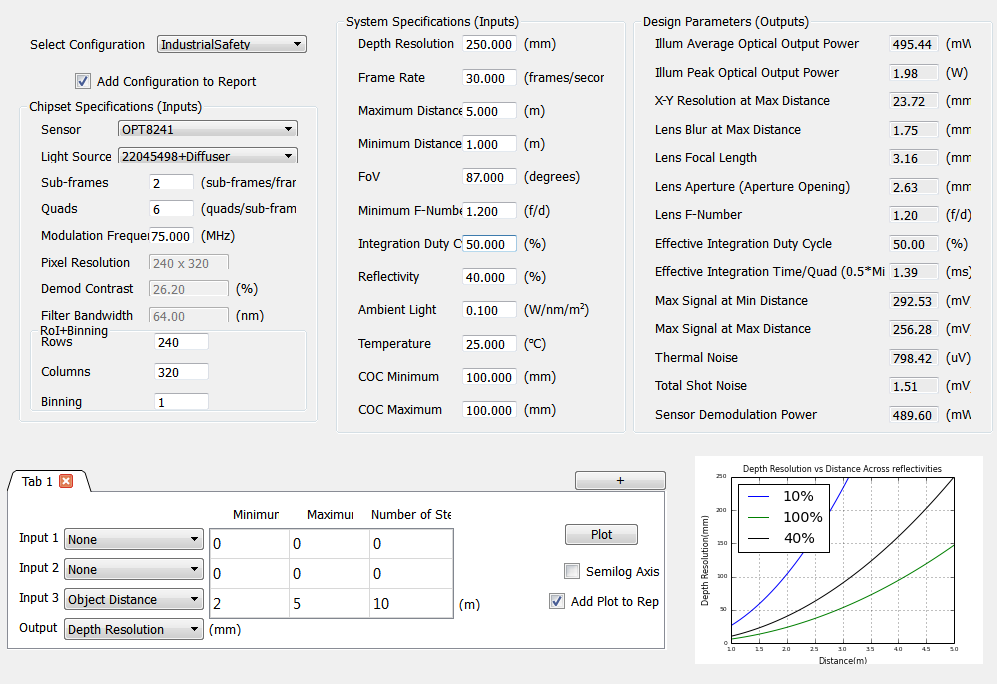 Figure 10. Screen Shot of the Estimator Tool
The illumination peak optical power of 1.98 W can be supplied using one high-power laser.
8.2.1.3 Application Curve
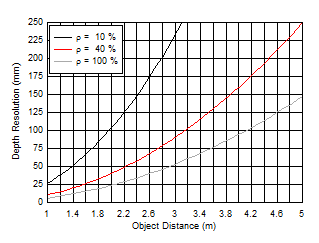
| ρ represents object reflectivity |
8.2.2 People Counting and Locating
Locating and tracking people is a complex problem to solve using regular RGB cameras. With the additional information of distance to each point in the scene, the algorithmic challenges become more surmountable, as shown in Figure 9.
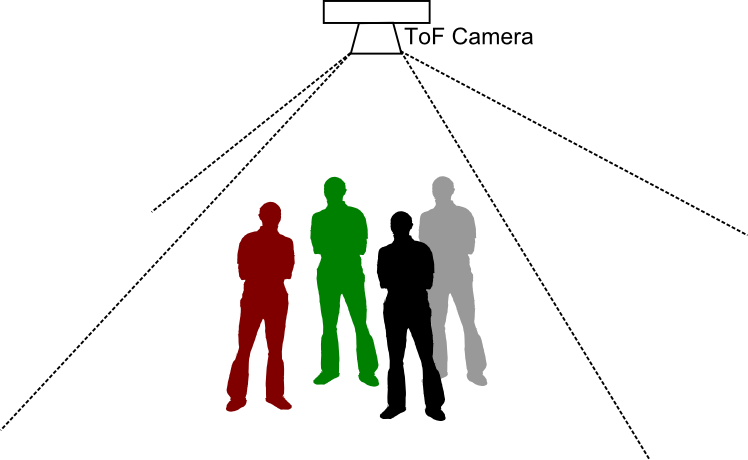 Figure 12. People Counting
8.2.2.1 Design Requirements
Table 4. People Counting Requirements
| SPECIFICATION | VALUE | UNITS | COMMENTS |
|---|---|---|---|
| Depth resolution | 200 | mm | For basic identification of shapes |
| Frame rate | 15 | Frames per second | Reasonable update rate for moderate object movement speeds |
| Field of view | 100.0 × 83.6 | Degrees (H × V) | Higher FoVs are better for more coverage but are worse from a power requirement point of view |
| Minimum distance | 1 | Meters | Example only, requirements may vary |
| Maximum distance | 6 | Meters | Example only, requirements may vary |
| Typical reflectivity of objects | 40 | Percentage | Assuming objects reflect very little infrared light and assuming Lambertian reflection. |
| Number of pixels | 320 × 240 | Rows × columns | Using a full array |
| Ambient light | 0 | W × nm × m2 around 850 nm | Indoor lighting conditions |
| Illumination source | LED | — | LED + lens optics |
8.2.2.2 Detailed Design Procedure
Using the TI ToF estimator tool, the ToF camera design requirements can be input and the power numbers required for achieving the desired specifications can be obtained by following the procedures discussed in this section.
8.2.2.2.1 Frequencies of Operation
The frequencies of operation are limited by the LED bandwidth because the source of illumination is an LED. Frequencies around 24 MHz can be used to obtain a good demodulation figure of merit if a fast-switching infrared (IR) LED is used. The unambiguous range is given by Equation 3.

8.2.2.2.2 Number of Sub-Frames and Quads
In this example, one sub-frame and four quads are used to minimize the effects of the sensor reset noise.
8.2.2.2.3 Field of View (FoV)
Field of view in the horizontal direction is 74.4 degrees. The diagonal field of view can be calculated using Equation 2.

The ratio of 5/4 is used to represent the ratio of the diagonal length to the horizontal length of the sensor.
8.2.2.2.4 Lens
A lens with a 1/3” image circle must be chosen. The field of view of the lens must match the requirements (that is, the FoV must be equal to 112.3 degrees, as calculated in Equation 4 ). A lower f.no is always better. For this example, use an f.no of 1.2.
8.2.2.2.5 Integration Duty Cycle
An integration duty cycle of 60% is chosen to keep the peak illumination power requirements low. Higher peak illumination power results in a higher number of illumination elements and, thus, an increase in system cost.
8.2.2.2.6 Design Summary
A screen shot of the system estimator tool is shown in Figure 13.
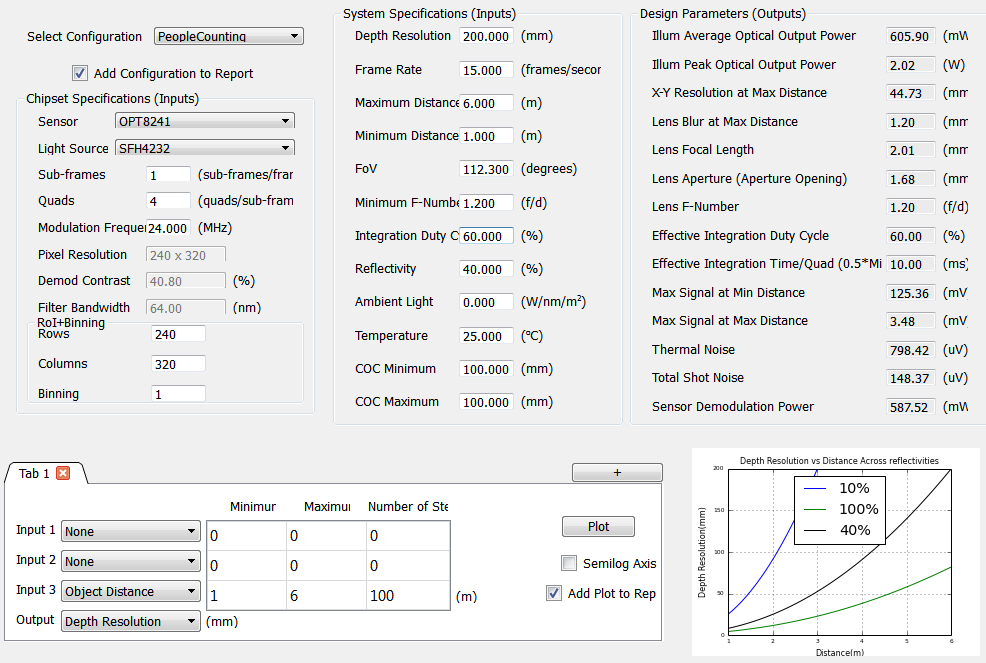 Figure 13. Screen Shot of the Estimator Tool
The illumination peak optical power of 2.0 W can be supplied using a single high-power LED.
8.2.2.3 Application Curve
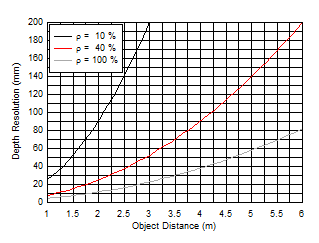
| ρ represents object reflectivity |
8.2.3 People Locating and Identification
A skeletal structure can be used to classify identified shapes (such as humans, machines, pets, and so forth). Other possibilities include classification of people (such as children and elderly). Even identification of humans by matching the shape and movement to an existing database is possible. Such information can lend itself for use in a variety of retail solutions, home safety, security, and public and private surveillance systems, as shown in Figure 15.
 Figure 15. People Counting and Identification
8.2.3.1 Design Requirements
Table 5. People Counting and Identification Requirements
8.2.3.2 Detailed Design Procedure
Using the TI ToF estimator tool, the ToF camera design requirements can be input and the power numbers required for achieving the desired specifications can be obtained. The choice of inputs to the estimator tool is explained in the following section.
8.2.3.2.1 Frequencies of Operation
The frequencies of operation are limited by the sensor bandwidth because the illumination source is a laser. Frequencies around 75 MHz can be used to obtain a good demodulation figure of merit. Two frequencies are used to implement de-aliasing and extend the unambiguous range because frequencies around 75 MHz provide a very short unambiguous range. The two frequencies chosen for de-aliasing are 70 MHz and 80 MHz. The unambiguous range is now given by Equation 5.

For the purpose of power requirement calculations, the average frequency of 75 MHz can be used in the estimator tool.
8.2.3.2.2 Number of Sub-Frames and Quads
In this example, one sub-frame and six quads are used to minimize the effects of the sensor reset noise. A depth resolution of 1% instead of the requirement of 1.5% is used as the resolution input to the estimator tool to allow for margins resulting from the additional noise when using de-aliasing.
8.2.3.2.3 Field of View (FoV)
Field of view in the horizontal direction is 74.4 degrees. The diagonal FoV can be calculated using Equation 6.

The ratio of 5/4 is used to represent the ratio of the diagonal length to the horizontal length of the sensor.
8.2.3.2.4 Lens
A lens with a 1/3” image circle must be chosen. The FoV of the lens must match the requirements (that is, the FoV must be equal to 112.3 degrees, as calculated in Equation 6). A lower f.no is always better. For this example, use an f.no of 1.2.
8.2.3.2.5 Integration Duty Cycle
An integration duty cycle of 70% is chosen to keep the peak illumination power requirements low. Higher peak illumination power results in a higher number of illumination elements and, thus, an increase in system cost.
8.2.3.2.6 Design Summary
A screen shot of the system estimator tool is shown in Figure 16.
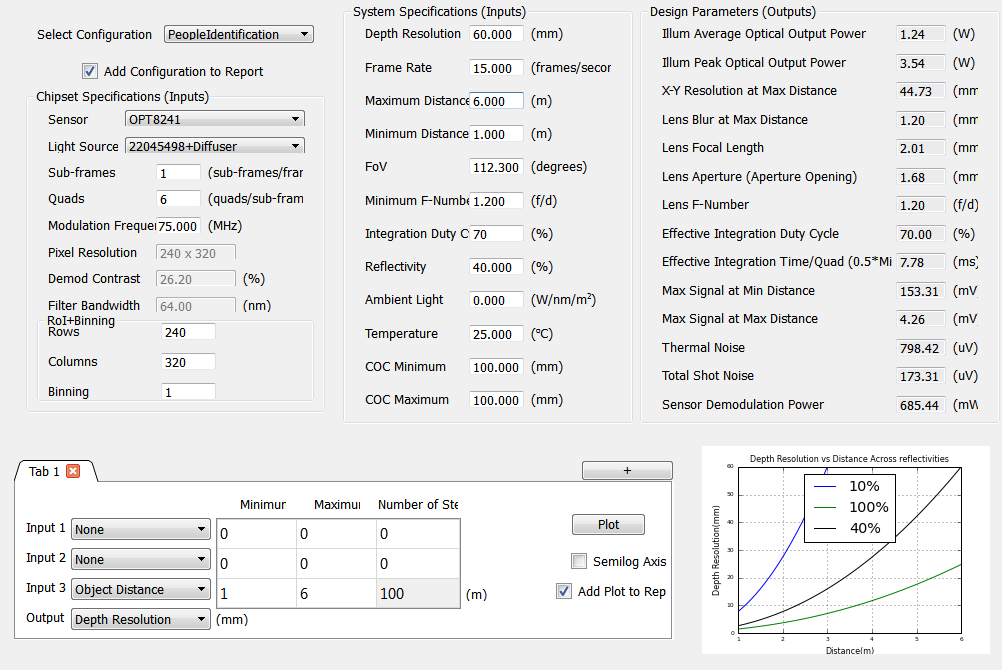 Figure 16. Screen Shot of the Estimator Tool
The illumination peak optical power of 3.54 W can be supplied using two high-power lasers.
8.2.3.3 Application Curve
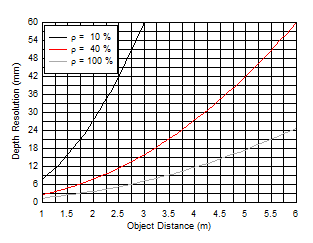
| ρ represents object reflectivity |