ZHCSET0D December 2015 – December 2019 TPS2H000-Q1
PRODUCTION DATA.
- 1 特性
- 2 应用
- 3 说明
- 4 修订历史记录
- 5 Device Comparison Table
- 6 Pin Configuration and Functions
- 7 Specifications
-
8 Detailed Description
- 8.1 Overview
- 8.2 Functional Block Diagram
- 8.3 Feature Description
- 8.4 Device Functional Modes
- 9 Application and Implementation
- 10Power Supply Recommendations
- 11Layout
- 12器件和文档支持
- 13机械、封装和可订购信息
9.2.3 Application Curves
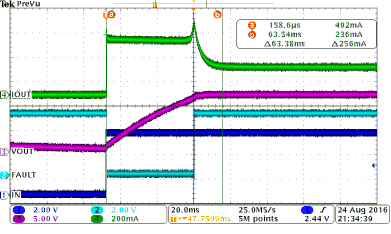
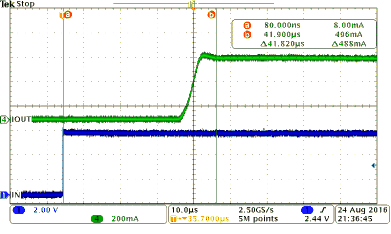
Figure 40 shows a test example of soft-start when driving a big capacitive load. Figure 41 shows an expanded waveform of the output current.

| Load current = 0.2 A | CH2 = FAULT | INx = ↑ |
| Current limit = 0.5 A | CH3 = output voltage | CH1 = INx |
| CL = 2.3 mF | CH4 = output current | VS = 12 V |

| Load current = 0.2 A | CH2 = FAULT | INx = ↑ |
| Current limit = 0.5 A | CH3 = output voltage | CH1 = INx |
| CL = 2.3 mF | CH4 = output current | VVS = 12 V |
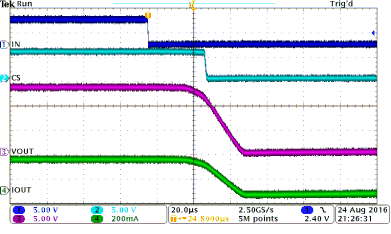
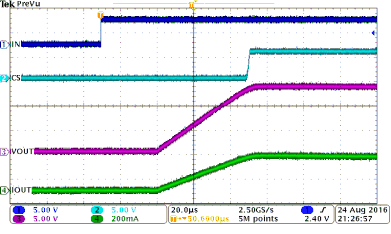
Figure 42 shows a test example of PWM-mode driving. Figure 43 shows the expanded waveform of the rising edge. Figure 44 shows the expanded waveform of the falling edge.

| INx = 200-Hz PWM, 50% duty cycle | CH2 = CS voltage | |
| VVS = 13.5 V | CH3 = output voltage | |
| CH1 = INx signal | CH4 = output current | |

| INx = 200-Hz PWM, 50% duty cycle | CH2 = CS voltage | |||
| VVS = 13.5 V | CH3 = output voltage | |||
| CH1 = INx signal | CH4 = output current | |||

| INx = 200-Hz PWM, 50% duty cycle | CH2 = CS voltage | |
| VVS = 13.5 V | CH3 = output voltage | |
| CH1 = INx signal | CH4 = output current | |