SBAU171D May 2010 – January 2016 ADS1198 , ADS1298
-
ADS1298ECG-FE/ADS1198ECG-FE
- Trademarks
- 1 ADS1298ECG-FE/ADS1198ECG-FE Overview
- 2 Quick Start
- 3
Using the ADS1298ECG-FE Software
- 3.1 Application User Menu
- 3.2 Top-Level Application Controls
- 3.3 About Tab
- 3.4 ADC Register Tab
- 3.5 Analysis Tab
- 3.6 Save Tab
- 4 ADS1x98ECG-FE Input Signals
- 5 ADS1298ECG-FE/ADS1198ECG-FE Hardware Details
- ASchematics, BOM, Layout, and ECG Cable Details
- BExternal Optional Hardware
- CSoftware Installation
3.5.2 Histogram Tab (Analysis)
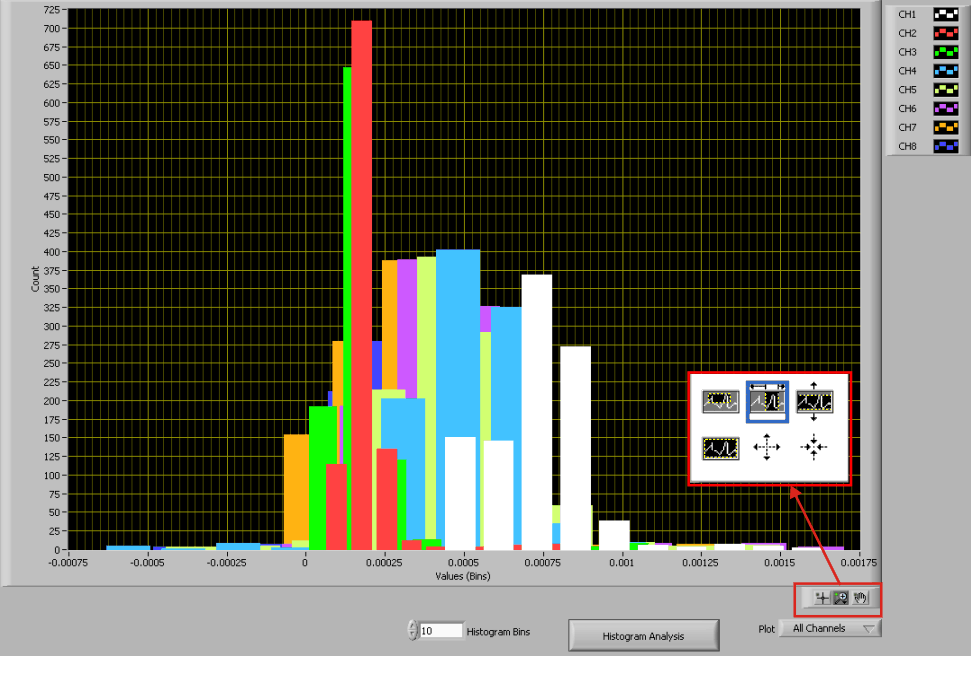
The Histogram tool is used primarily to see the bin separation of the different amplitudes of the ECG waveform harmonics. Figure 20 illustrates the histogram output for a 12-lead signal. The same ECG Signal Zoom analysis may be used on the histogram plots for a more detailed examination of the amplitude bins.
 Figure 20. Histogram Bins for 12-Lead ECG Signal
 Figure 21 shows the Histogram Analysis window that is displayed when the Histogram Analysis button (at the bottom of the screen in Figure 20) is clicked. The analysis window shows the mean, VRMS, and VPP channel amplitude bins.
 Figure 21. Statistics for the Signal Amplitude of Eight ECG Channels