SBOU157 September 2015 OPT8241
- Voxel Viewer
2.3 Main Viewport
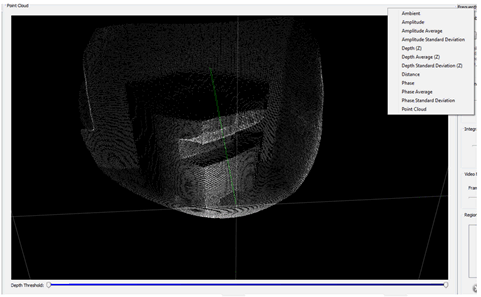
The main viewport is the largest display window, and is best used for visualizing 3D point clouds, though other data can be displayed in this viewport as well. To choose the data source, simply right-click on the frame of the main viewport window to bring up a selection box. The different data sources are described in Section 3.3.
At the bottom of the Main Viewport is a double-ended slider. The adjustment sliders are used to clip the point clouds based on the z-value of each pixel—the left slider sets the lower-limit, and the right slider sets the upper-limit. Only those points whose z-values are between the limits are displayed.
 Figure 10. Main Viewport