SLAA517F May 2012 – August 2021 MSP430F6720A , MSP430F6720A , MSP430F6721A , MSP430F6721A , MSP430F6723A , MSP430F6723A , MSP430F6724A , MSP430F6724A , MSP430F6725A , MSP430F6725A , MSP430F6726A , MSP430F6726A , MSP430F6730A , MSP430F6730A , MSP430F6731A , MSP430F6731A , MSP430F6733A , MSP430F6733A , MSP430F6734A , MSP430F6734A , MSP430F6735A , MSP430F6735A , MSP430F6736 , MSP430F6736 , MSP430F6736A , MSP430F6736A
6.1 Viewing Results
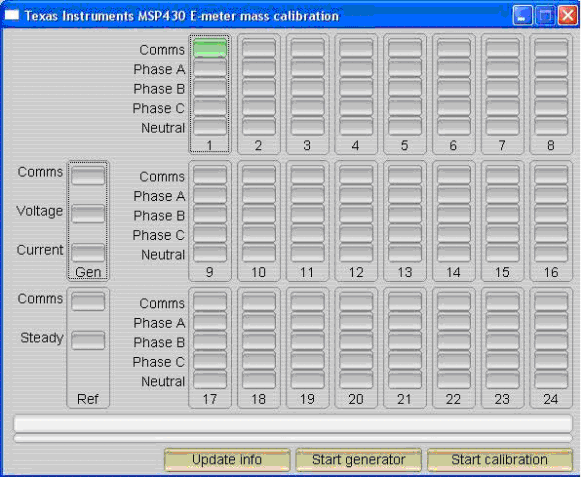
Once the meter is turned ON, the results can be easily viewed using this GUI by connecting the RS-232 header to the PC. Run calibrator.exe in the GUI folder.
 Figure 6-1 E-Meter Mass Calibration
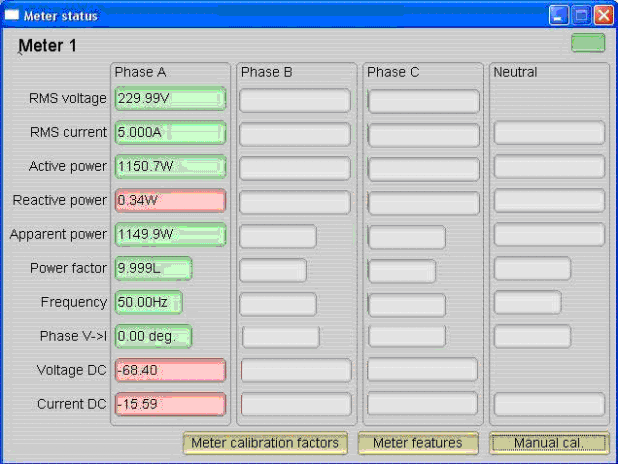
Under correct connections, you should see the GREEN filled button under "Comms". If there are problems with connections or if the code is not configured correctly, the button will be RED in color. Click on the green button to see the meter results immediately on the GUI.
 Figure 6-2 Meter Status
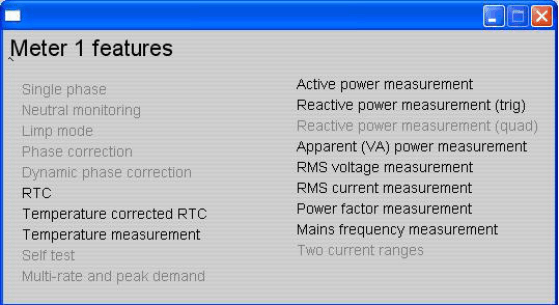
The configuration of the meter can also be viewed by clicking on "Meter features" (Example only) to get the screen shown in Figure 6-3.
 Figure 6-3 Meter 1 Features
Results can also be viewed as pulses fed back to any energy meter test setup. Energy pulses for total active and total reactive energies are available at JP9 and JP12 (ACT) and JP14 and JP13 (REACT). In addition, the pulses go through on-board opto-couplers that might be necessary for interface to any test equipment. Look at Table 5-1 and choose the right header for energy pulses.