SLAA991 December 2020 TMUXHS4212
3 Cascading Multiplexers Testing
3.1 Simulation with S-parameters Model for Cascading Multiplexers
Now let’s look at an example of simulation with S-parameters model for two cascading TMUXHS4212 multiplexers. S-parameters are easily imported and used for circuit simulations in EDA tools like ADS. S-parameters are the shared language between simulation and measurement.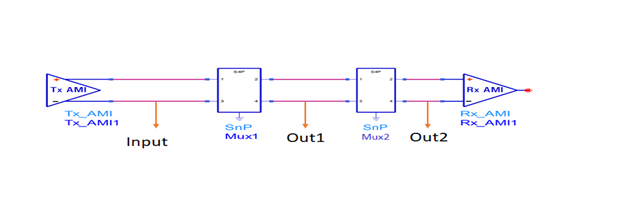 Figure 3-1 ADS Simulation of Cascading
Multiplexers.
 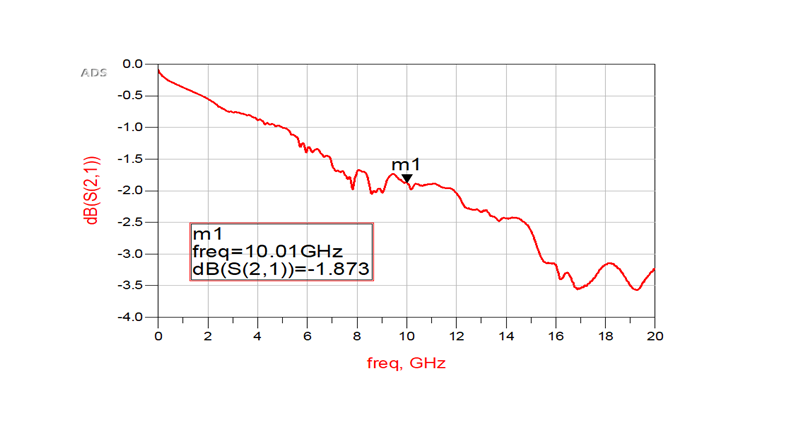 Figure 3-2 Insertion Loss of
TMUXHS4212.
 Figure 3-3 is the eye diagram of the 10-Gbps input signal, Figure 3-4 is the output eye diagram from the first multiplexer, Figure 3-5 is the output eye diagram from second multiplexer. From Figure 3-5, we can see waveform is degraded after two cascading multiplexers.
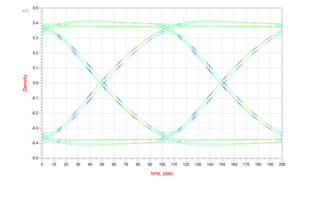 Figure 3-3 Input Signal Eye Diargam
at 10Gbps.
 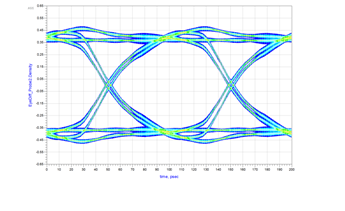 Figure 3-4 Eye Diagram after 1st
Multiplexer.
 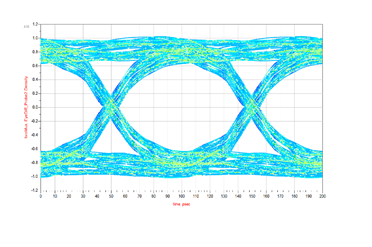 Figure 3-5 Eye Diagram after 2nd
Multiplexer.
 3.2 Testing Results with Scope
Last, let’s look at the real scope measurement and see how they correlate with the simulation result. Figure 3-6 is the waveform of the 10Gbps input signal, Figure 3-7 is the output waveform from the first multiplexer, Figure 3-8 is the output waveform form the second multiplexer. From Figure 3-7 and Figure 3-8, real measurement is correlated well with simulation result.
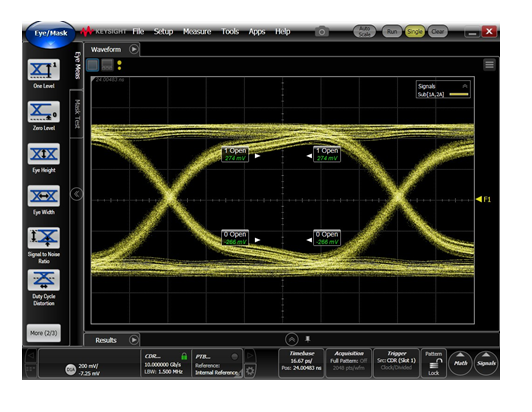 Figure 3-6 Input Waveform of 10Gbps Signal.
 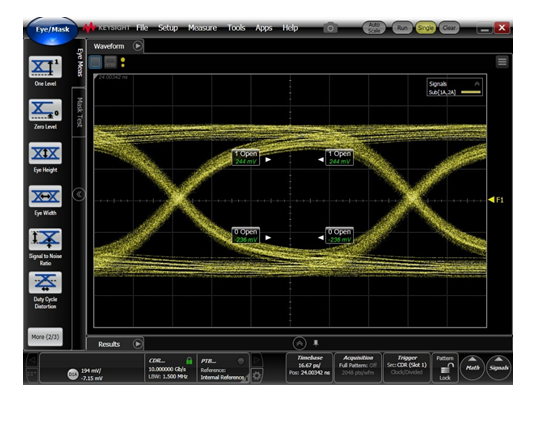 Figure 3-7 Output Waveform after 1st Multiplexer.
 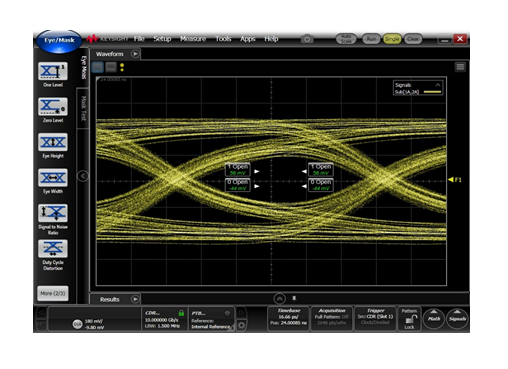 Figure 3-8 Output Waveform after 2nd Multiplexer.