SLAAE55 September 2022 DAC11001B
4 Performance Test Result
This document compares performance data taken on the DAC11001B with data for similar devices available in the market. The total harmonic distortion (THD) and total harmonic distortion, plus noise (THD+N), evaluates high-fidelity tones. The APx555B high-performance audio analyzer used to measure signal chain performance.
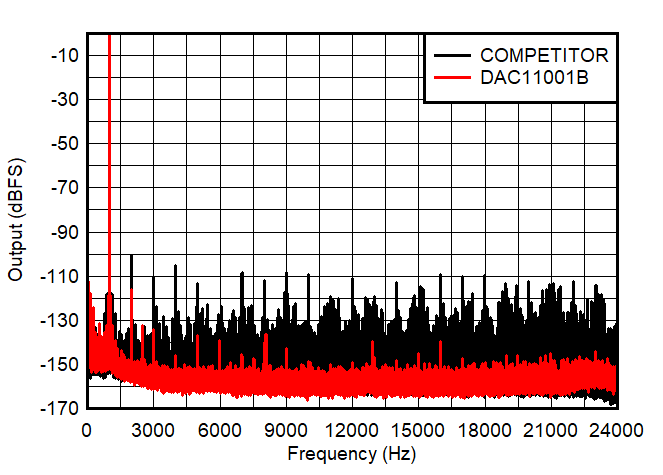
Table 4-1 and Figure 4-1 compare the spectrum performance of the DAC11001B and a competitor part while generating a 1 kHz sine tone with a 10 kSPS update rate and 9 Vpp amplitude.
The DAC11001B signals chain provides -115dB THD and -105 dB THD+N performance, which is almost a 20 dB improvement in the distortion over the competitor's performance.
| Device | Frequency | THD | THD+N |
|---|---|---|---|
| DAC11001B | 1 kHz | -115 dB | -105 dB |
| COMPETITOR | 1 kHz | -96 dB | -95 dB |
 Figure 4-1 Spectrum DAC11001B vs
Competitor – 1 kHz, 10 kSPS Update Rate, 9Vpp
Figure 4-1 Spectrum DAC11001B vs
Competitor – 1 kHz, 10 kSPS Update Rate, 9Vpp| Parameter | Value |
|---|---|
| Pattern | Sine |
| Output voltage | 9 Vp-p |
| DAC output signal frequency | 1 kHz to 20kHz |
| DAC update rate | 768 kSPS |
| SPI, SCLK frequency | 38.4 MHz |
| Reference voltage | ±4.5 V |
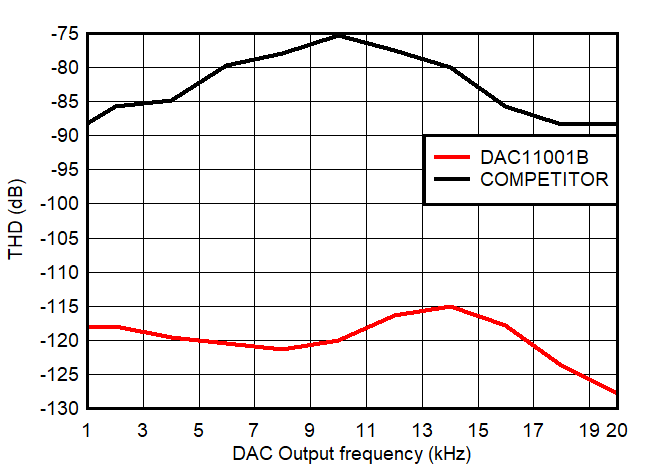
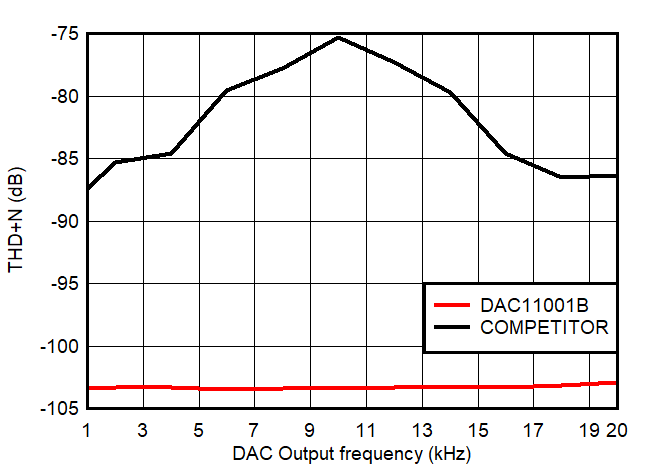
Figure 4-2 and Figure 4-3 show the THD and THD+N performance of the DAC11001B and competitor part across frequency (1 kHz to 20 kHz) at 768 kSPS update rate.
 Figure 4-2 THD Performance
 Figure 4-3 THD+N Performance