SLVAEF4C august 2019 – may 2023 TPS7H4001-SP
PRODUCTION DATA
- 1
- Single-Event Effects Test Report of the TPS7H4001-SP
- Trademarks
- 1 Introduction
- 2 Single-Events Effects (SEE)
- 3 Test Device and Evaluation Board Information
- 4 Irradiation Facility and Setup
- 5 Depth, Range, and LETEFF Calculation
- 6 Test Setup and Procedures
- 7 Destructive Single-Event Effects (DSEE)
- 8 Single-Event Transients (SET)
- 9 Summary
- 10Total Ionizing Dose (TID) From SEE Experiments
- 11References
- 12Revision History
7.1 Safe-Operating-Area (SOA) Results
Many TPS7H4001-SP devices were characterized across voltage, load current, and LETEFF by sweeping the variables. The purpose of this experiment was to determined the values at which destructive effects were observed, when controlling the variables. During the testing, only one variable was changed (sweep) at a time while the other remain constant at the maximum permissible values. The maximum values for each sweep variable is presented in Table 7-1. When collecting data for the DSEE of the TPS7H4001-SP, it was observed that the probability of damaging a device was greater at higher temperatures, consequently most of the DSEE data was collected at this temperature. During DSEE testing on runs 3, 11, 65, 67, and 69 the TPS7H4001-SP was tested for cross-conduction. Cross-conduction was tested by monitoring the phase to GND (low-side NMOS FET) and the PVIN to phase (high-side PMOS FET, by using a differential probe) and triggered using a AND digital trigger on the DPO7104C. The trigger VIH (or logic 1) was specified as 500 mV. During the runs not a single upset was capture indicating that the TPS7H4001-SP did not suffer from cross-conduction upsets.
Notice that even when separate sections and chapter were created to present the SEL, SEB/SEGR, and SET in a more organized fashion, the DSEE terminology encapsulated all the device damage during the heavy-ion testing campaign regarding the temperature. This is valid since Flux of ≈105 ions/cm2·s was used for all runs.
| Variable Name | Maximum Value | Units |
|---|---|---|
| PVIN = VIN | 7 | V |
| Load current (ILOAD) | 18 | A |
| LETEFF | 75 | MeV·cm2/mg |
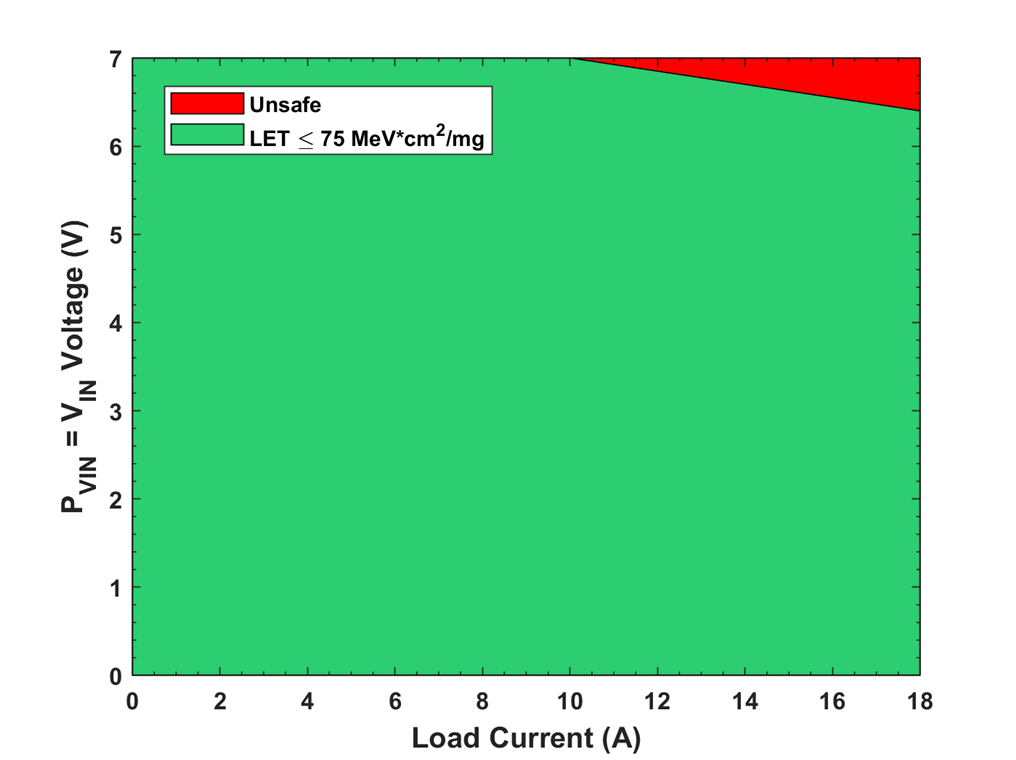
For LETEFF ≤ 75 MeV·cm2/mg and load current of 18 A, the maximum permissible voltage to avoid DSEE is 6.4 V. Maximum voltage of 7 V can be achieved at LET≤ 75 MeV·cm2/mg when the load current is decremented to ≤ 10 A. A visual representation of the SOA curve can be observed in Figure 7-1. The green area summarized the points were the TPS7H4001-SP can be operated at LET ≤ 75 MeV·cm2/mg, without risk of damage. The red area represents the points where DSEE was observed, consequently the operating points must be avoided to reliably use TPS7H4001-SP.
DSEE failures were observed under the red area. The cross-section for these event is extremely small. During the SEE test campaign of the TPS7H4001-SP 17 units were damage from a total of 37. Table 7-2 shows the calculated upper-bound cross section when combining the fluences for all runs with same load,voltage and LETEFF. The cross section values shown on the table calculated are calculated at 95% confidence interval (refer to SLVK047 for more details in the method used to calculate the upper bound cross section).
| Device Damage (#) | Total Units Tested (#) | Voltage (V) | Current (A) | LETEFF(MeV·cm2/mg) | Upper Bound Cross Section (cm2/device) |
|---|---|---|---|---|---|
| 1 | 3 | 7 | 18 | 49.3 | 1.79 × 10⁻⁷ |
| 1 | 2 | 7 | 18 | 54.8 | 2.93 × 10⁻⁷ |
0 | 4 | 5 | 18 | 66.37 | 9.22 × 10⁻⁸ |
0 | 1 | 6.25 | 18 | 66.37 | 3.69 × 10⁻⁷ |
0 | 1 | 6.4 | 18 | 66.37 | 3.69 × 10⁻⁷ |
1 | 3 | 6.5 | 18 | 66.37 | 2.57 × 10⁻⁷ |
0 | 1 | 6.6 | 18 | 66.37 | 3.71 × 10⁻⁷ |
0 | 1 | 6.75 | 18 | 66.37 | 3.69 × 10⁻⁷ |
0 | 1 | 6.8 | 18 | 66.37 | 3.69 × 10⁻⁷ |
1 | 7 | 7 | 18 | 66.37 | 8.53× 10⁻⁸ |
0 | 3 | 5 | 18 | 74.95 | 6.15 × 10⁻⁸ |
0 | 3 | 6 | 18 | 74.95 | 1.23 × 10⁻⁷ |
0 | 2 | 6.25 | 18 | 74.95 | 1.84 × 10⁻⁷ |
0 | 1 | 6.3 | 18 | 74.95 | 3.69 × 10⁻⁷ |
0 | 1 | 6.375 | 18 | 74.95 | 3.7 × 10⁻⁷ |
3 | 5 | 6.5 | 18 | 74.95 | 2.56 × 10⁻⁷ |
0 | 1 | 6.7 | 18 | 74.95 | 3.69 × 10⁻⁷ |
0 | 1 | 6.75 | 18 | 74.95 | 1.84 × 10⁻⁷ |
0 | 1 | 7 | 9 | 74.95 | 3.7 × 10⁻⁷ |
0 | 3 | 7 | 10 | 74.95 | 1.27 × 10⁻⁷ |
1 | 2 | 7 | 11 | 74.95 | 4.57 × 10⁻⁷ |
0 | 1 | 7 | 12 | 74.95 | 3.69 × 10⁻⁷ |
1 | 1 | 7 | 13.5 | 74.95 | 7.13 × 10⁻⁷ |
1 | 2 | 7 | 14 | 74.95 | 4.57 × 10⁻⁷ |
0 | 1 | 7 | 16 | 74.95 | 3.69 × 10⁻⁷ |
3 | 13 | 7 | 18 | 74.95 | 5.84 × 10⁻⁸ |
0 | 1 | 5 | 18 | 75.82 | 1.84 × 10⁻⁷ |
4 | 9 | 7 | 18 | 75.82 | 7.84 × 10⁻⁸ |
 Figure 7-1 SOA Curve for the TPS7H4001-SP