SLVAEF4C august 2019 – may 2023 TPS7H4001-SP
PRODUCTION DATA
- 1
- Single-Event Effects Test Report of the TPS7H4001-SP
- Trademarks
- 1 Introduction
- 2 Single-Events Effects (SEE)
- 3 Test Device and Evaluation Board Information
- 4 Irradiation Facility and Setup
- 5 Depth, Range, and LETEFF Calculation
- 6 Test Setup and Procedures
- 7 Destructive Single-Event Effects (DSEE)
- 8 Single-Event Transients (SET)
- 9 Summary
- 10Total Ionizing Dose (TID) From SEE Experiments
- 11References
- 12Revision History
8 Single-Event Transients (SET)
SET are defined as heavy-ion-induced transients upsets on the VOUT, SS, and the PWRGD flag of the TPS7H4001-SP. SET testing was performed at room temperature (no external temperature control used), using Praseodymium (141Pr) and Holmium (165Ho) heavy-ions. For 141Pr ion angles of incidence of 0° and 27.3° were used for an LETEFF of 66.37 and 74.95 MeV·cm2/mg, respectively. 165Ho ion at angle of incidence of 0° was used for an LETEFF of 75.82 MeV·cm2/mg.
VOUT SETs were characterize using a window trigger of ±3% (±30 mV) around the nominal output voltage (≈1 – V). The devices were characterize under PVIN = VIN = 5 and 7 V. The output load was set to 18 A for all runs by using a discrete power resistor of 55 mΩ. The DPO7104C was used for the characterization of the VOUT transients. The output voltage was monitored by using the cold nose probe (J8). Sample rate of 20 MS/s and time of 200 μs/div (total of 2 ms) and 2 ms/div (total of 20 ms) were used during the characterization. For runs 80 and 90, the trigger signal used for the characterization was changed from VOUT to soft start to validate the fact that at room temperature any SSSET upset was observed. Even in the cases when the trigger signal was VOUT, this kind of upset (SSSET) can be identified since the voltage drops near zero and has a long transient recovery time. It is important to note that no upset of this kind (SSSET) was observed during the SET or the SEB/SEGR testing. The vertical division of the DPO was optimized to minimize noise while having enough dynamic range to capture the upsets magnitude without saturation. The scope bandwidth was set to 20 MHz for all the data collection. The vertical division use during the SET characterization of the TPS7H4001-SP was between 10 and 20 mV/div. DC coupling with vertical offset and AC coupling was used as part of the data collection. Test conditions and results for the SET characterization of the TPS7H4001-SP are shown in Table 8-1 and Summary of the TPS7H4001-SP SET Test Conditions and Results at PVIN = VIN = 5 V.
It was observed that the numbers of upsets at VOUT decrement with PVIN = VIN voltage for that reason the worst case (7 V) and typical rail voltage of 5 V were used for the characterization. All the observed upsets were positive on polarity. While most of the upsets were fast on the recovery time (between 10 μs to 22 μs), a total of 4 upsets with slow recovery time (in the milliseconds range) were observed. Transient time was calculated using the full-width-half-medium (FWHM) method. This method measure the time the output voltage takes pass by half of the maximum voltage for the given upset. The histogram of all recorded upsets is shown in Figure 8-1. A histogram of the normalized maximum voltage for all recorded upsets is shown on Figure 8-2. As can be observed most of the upsets are bounded between 3% and 5% with two upsets that have higher values than the typical or outlier. These upsets correlate with upsets that have long transient time. Time domain plots for typical VOUT upsets are shown in Figure 8-3 and Figure 8-4, for the slow and fast transient time, respectively.
PWRGD SETs were characterized by monitoring the signal using the TP23 test point on the EVM. An edge-negative trigger with trigger value set to half the PVIN = VIN voltage was used for the characterization. For runs # 80-81 and #88-92, a low pass filter (R-C) was installed on the EVM to mitigate the SETs on the PWRGD signal. The resistor R47 was set to 1.15 kΩ while the capacitor C118 was set to 1 nF for the filter. As can be observed, the filter concept is a viable option since most of the PWRGDSET were filtered during this runs. A typical PWRGD SET is shown in Figure 8-5.
The upper-bound cross section at 95% confidence interval values is shown in Table 8-3 (see SLVK047 for more details in the method used to calculate the upper bound cross section).
During run # 80 the trigger signal was changed from VOUT to SS
| Run # | Unit # | Ion Type | Angle of Incidence (°) | LETEFF (MeV·cm2 /mg) | Flux (ions/cm2 ·s ) | Fluence (ions/cm2 ) | -3% ≤ VOUT ≤3% (from the Nominal Voltage) | PWRGD ≤ (VIN/2) | PWRGDFILTERED ≤ (VIN/2) |
|---|---|---|---|---|---|---|---|---|---|
| 70 | 11 | 141Pr | 0 | 66.37 | 1.13E+05 | 1.00E+07 | 0 | 23 | Not Installed |
| 71 | 13 | 141Pr | 0 | 66.37 | 1.01E+05 | 1.00E+07 | 0 | 17 | |
| 72 | 22 | 141Pr | 0 | 66.37 | 9.21E+04 | 1.00E+07 | 0 | 21 | |
| 73 | 23 | 141Pr | 0 | 66.37 | 9.39E+04 | 9.95E+06 | 0 | 23 | |
| 74 | 21 | 141Pr | 27.3 | 74.95 | 1.09E+05 | 9.98E+06 | 0 | 17 | |
| 75 | 21 | 141Pr | 27.3 | 74.95 | 8.86E+04 | 1.00E+07 | 0 | 32 | |
| 76 | 21 | 141Pr | 27.3 | 74.95 | 1.06E+05 | 9.98E+06 | 0 | 17 | |
| 77 | 21 | 141Pr | 27.3 | 74.95 | 1.31E+05 | 1.00E+07 | 0 | 19 | |
| 78 | 22 | 141Pr | 27.3 | 74.95 | 8.89E+04 | 1.00E+07 | 0 | 19 | |
| 79 | 23 | 141Pr | 27.3 | 74.95 | 9.73E+04 | 1.00E+07 | 0 | 21 | |
| 80 | 7 | 165Ho | 0 | 75.82 | 1.01E+05 | 1.01E+07 | 0(Trigger=SS) | 0 | 0 |
| 81 | 7 | 165Ho | 0 | 75.82 | 8.54E+04 | 9.95E+06 | 0 | 0 | 0 |
N/A in numbers of Upset on VOUT column, means the scope was not used for the specific run. N/A in the PWRGDFILTERED column means the low pass filter was not installed, during the run.
During run # 90 the trigger was changed from VOUT to SS.
| Run # | Unit # | Ion Type | Angle of Incidence (°) | LETEFF (MeV·cm2 /mg) | Flux (ions/cm2 ·s ) | Fluence (ions/cm2 ) |
Damage? |
-3% ≤ VOUT ≤3% (from the Nominal Voltage) | PWRGD ≤ (VIN/2) | PWRGDFILTERED ≤ (VIN/2) |
|---|---|---|---|---|---|---|---|---|---|---|
| 82 | 13 | 141Pr | 0 | 66.37 | 9.75E+04 | 1.00E+07 | No | 3 | 7 | N/A |
| 83 | 22 | 141Pr | 0 | 66.37 | 1.06E+05 | 1.00E+07 | No | 8 | 4 | N/A |
| 84 | 23 | 141Pr | 0 | 66.37 | 9.34E+04 | 9.96E+06 | No | 9 | 7 | N/A |
| 85 | 21 | 141Pr | 27.3 | 74.95 | 1.45E+05 | 9.96E+06 | No | 33 | 6 | N/A |
| 86 | 22 | 141Pr | 27.3 | 74.95 | 1.03E+05 | 9.99E+06 | No | 21 | 3 | N/A |
| 87 | 23 | 141Pr | 27.3 | 74.95 | 9.46E+04 | 9.97E+06 | No | 37 | 1 | N/A |
| 88 | 1 | 165Ho | 0 | 75.82 | 1.15E+05 | 2.94E+06 | Yes | N/A | 1 | 0 |
| 89 | 7 | 165Ho | 0 | 75.82 | 1.12E+05 | 1.00E+07 | No | 39 | 6 | 1 |
| 90 | 7 | 165Ho | 0 | 75.82 | 1.11E+05 | 1.01E+07 | No | 0(Trigger=SS) | 1 | 0 |
| 91 | 8 | 165Ho | 0 | 75.82 | 1.11E+05 | 6.41E+06 | Yes | 31 | 4 | 1 |
| 92 | 9 | 165Ho | 0 | 75.82 | 8.59E+04 | 4.63E+06 | Yes | 23 | 0 | 0 |
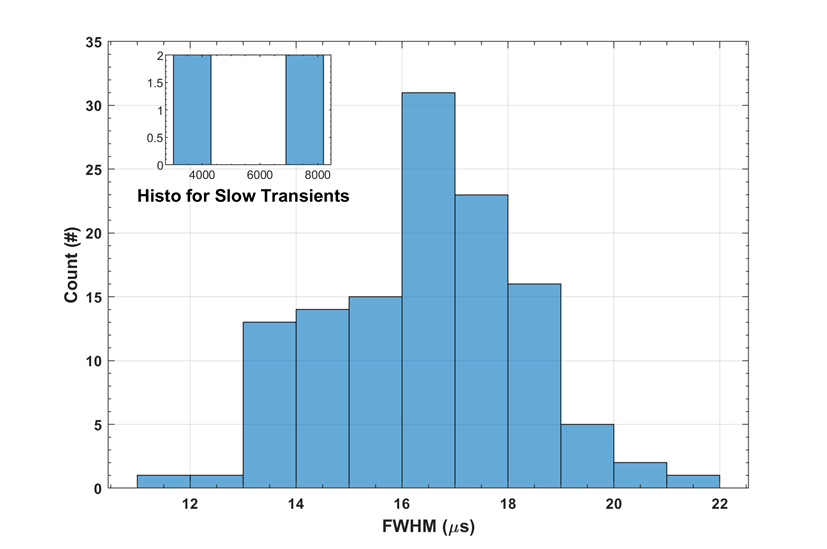 Figure 8-1 Histogram of the Transient Time
for All Upset SETs
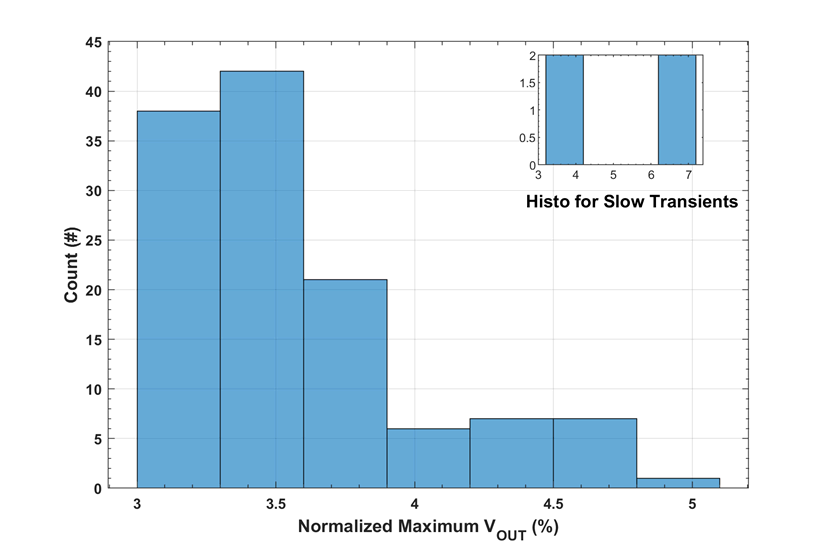 Figure 8-2 Histogram of the Normalized
Maximum Voltage for All Observed SETs
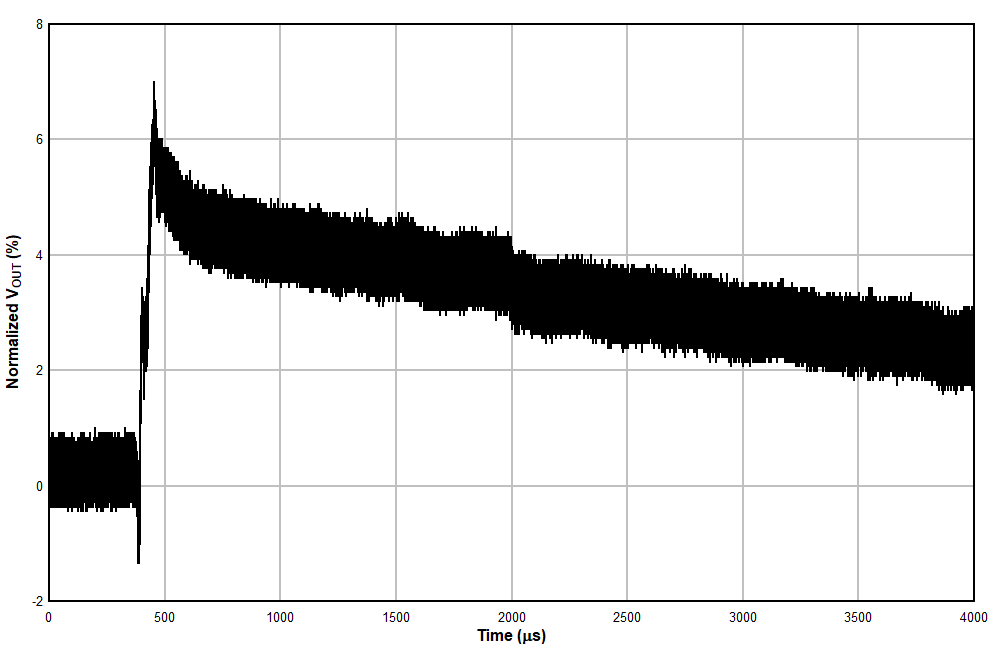 Figure 8-3 Long (Slow) Transient Time Upset on
VOUT
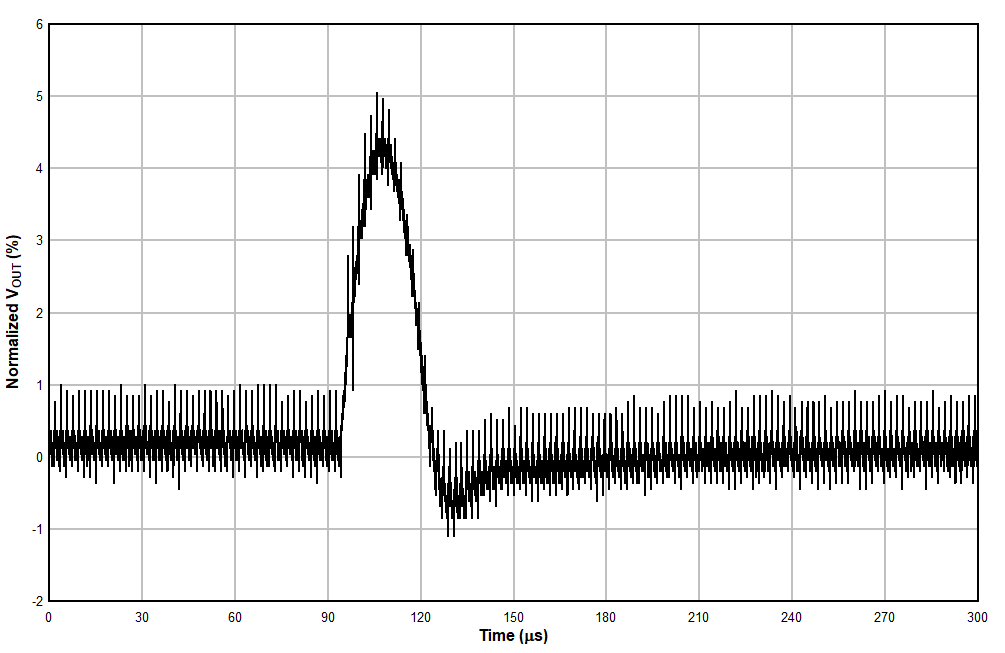 Figure 8-4 Typical (Fast) Upset on
VOUT
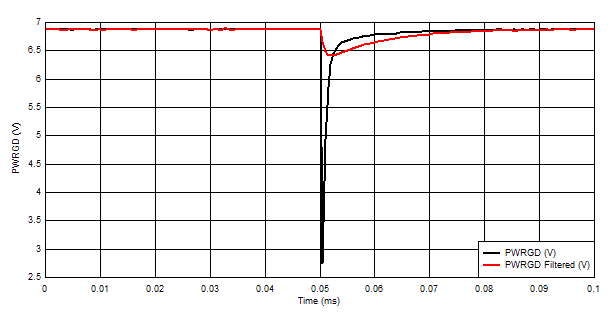 Figure 8-5 Typical PWRGD Upset With and Without Filtering
| LETEFF (MeV·cm2/mg) | PVIN = VIN (V) | # of VOUT ≥ |3%| Upsets | VOUT Cross-Section (≥ |3%|) [cm2/device] | # of PWRGD ≤ VIN / 2 Upsets | PWRGD Cross-Section (≤ VIN / 2) [cm2/device] |
|---|---|---|---|---|---|
| 66.37 | 5 | 0 | 9.21 x 10⁻⁸ | 84 | 2.6 x 10⁻⁶ |
| 75 | 0 | 5.27 x 10⁻⁸ | 125 | 1.86 x 10⁻⁶ | |
| 66.37 | 7 | 20 | 1.03 x 10⁻⁶ | 18 | 9.47 x 10⁻⁷ |
| 75 | 184 | 4.17 x 10⁻⁶ | 22 | 5.21 x 10⁻⁷ |