SLVK147A August   2023  – September 2023 TPS7H2201-SEP

PRODUCTION DATA  

  1.   1
  2.   Trademarks
  3. 1Device Information
    1. 1.1 Product Description
    2. 1.2 Device Details
  4. 2Total Dose Test Setup
    1. 2.1 Test Overview
    2. 2.2 Test Description and Facilities
    3. 2.3 Test Setup Details
      1. 2.3.1 Unbiased
      2. 2.3.2 Biased
    4. 2.4 Test Configuration and Condition
  5. 3TID Characterization Test Results
    1. 3.1 TID Characterization Summary Results
    2. 3.2 TPS7H2201-SEP Specification Compliance Matrix
  6. 4Applicable and Reference Documents
    1. 4.1 Applicable Documents
    2. 4.2 Reference Documents
  7. 5Revision History
  8.   A Appendix: HDR TID Report Data

Biased

The TPS7H2201-SEP biased exposure was performed with a 7-V bias on the Vin and Enable pins. Figure 2-1 shows the biased diagram that was used for HDR exposure.
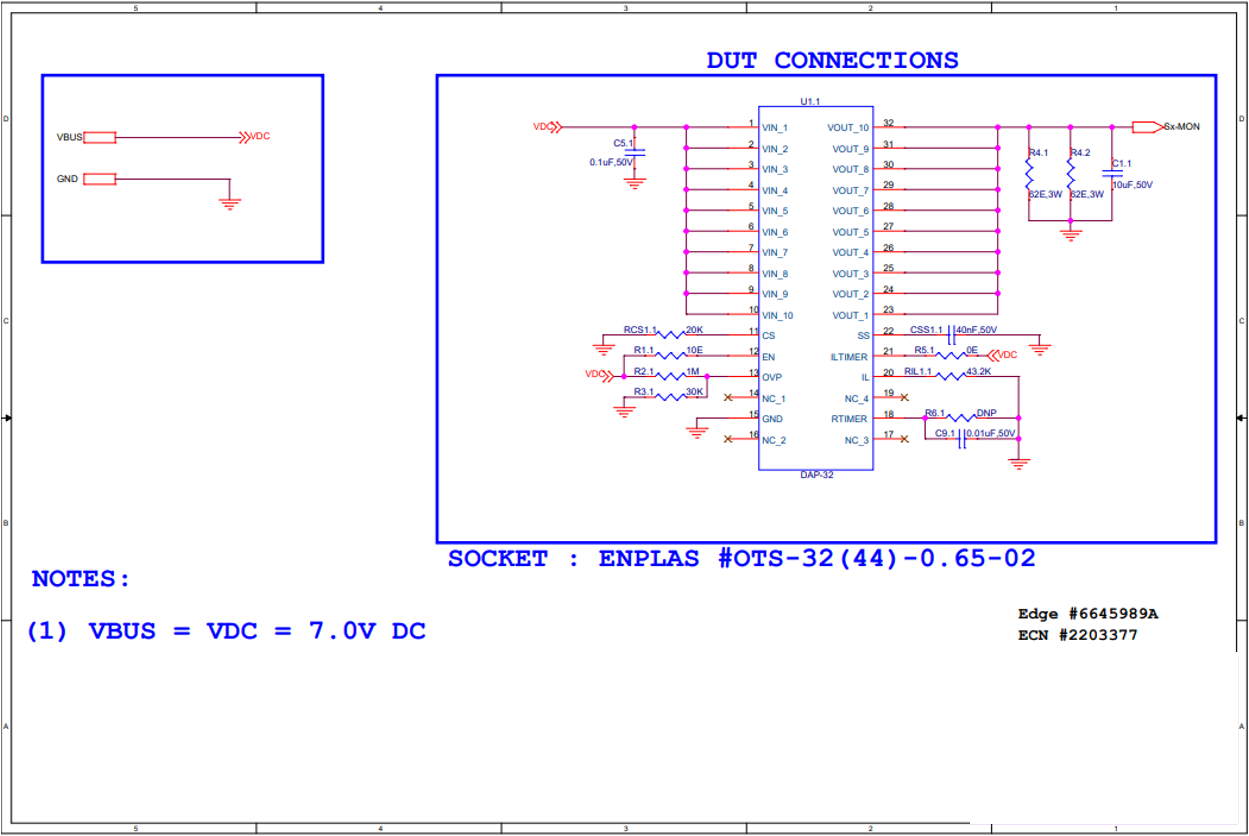
GUID-B98BB65A-355D-4B5A-827E-36171FF80602-low.png

Sequence = VDC. Bulk capacitors added to all PS.

Figure 2-1 Bias Diagram Used in TID Exposure
Table 2-1 Biased Source Configuration
VDC (V) VDC (mA/device)
7 250