SLVUBW7 May 2020
- TPS7H4001QEVM-CVAL Evaluation Module User's Guide
4.9 Current Sharing
One important consideration when operating devices in parallel configuration is how the total current is shared among the converters. Designers of such parallel systems want to ensure that each converter remains within the recommended operating conditions of the data sheet while also considering worst case conditions. Ensuring this is not a trivial task but can be achieved through various approaches. The most straight forward approach, and the one resulting in the most conservative design, is to take the worst case condition and apply it to all converters regardless of the statistical improbability of such an occurrence. Another approach is to characterize the devices in a parallel system allowing designers to eliminate a signficant amount of variation by having an understanding of the baseline starting point under nominal conditions.
Regardless of the approach, an assumption is made that the ouput current of each converter will be proportional to that converter's power stage transconductance (gmps, or COMP to Iswitch gm in the data sheet). Looking at the electrical characteristics table of the data sheet, one can see that this parameter is specified with an approximate tolerance of +/- 28% regardless of temperature. Without applying any practical engineering judgement, this specification says that in order to guarantee that no single converter exceeds the ROC peak current of 18A (assuming 10% current peaking), the nominal design would target ~13.5A. Allowing for lowest gmps (-28%), the design would provide 9.8A per converter. Extrapolating this worst case even further by assuming all four parallel converters would have the lowest gmps value, a 4-channel parallel design would provide ~39A of total load current. One can certainly design with such assumptions and create a very conservative design. However, doing so would ignore the fact that realizing such a worst case implementation is highly improbable.
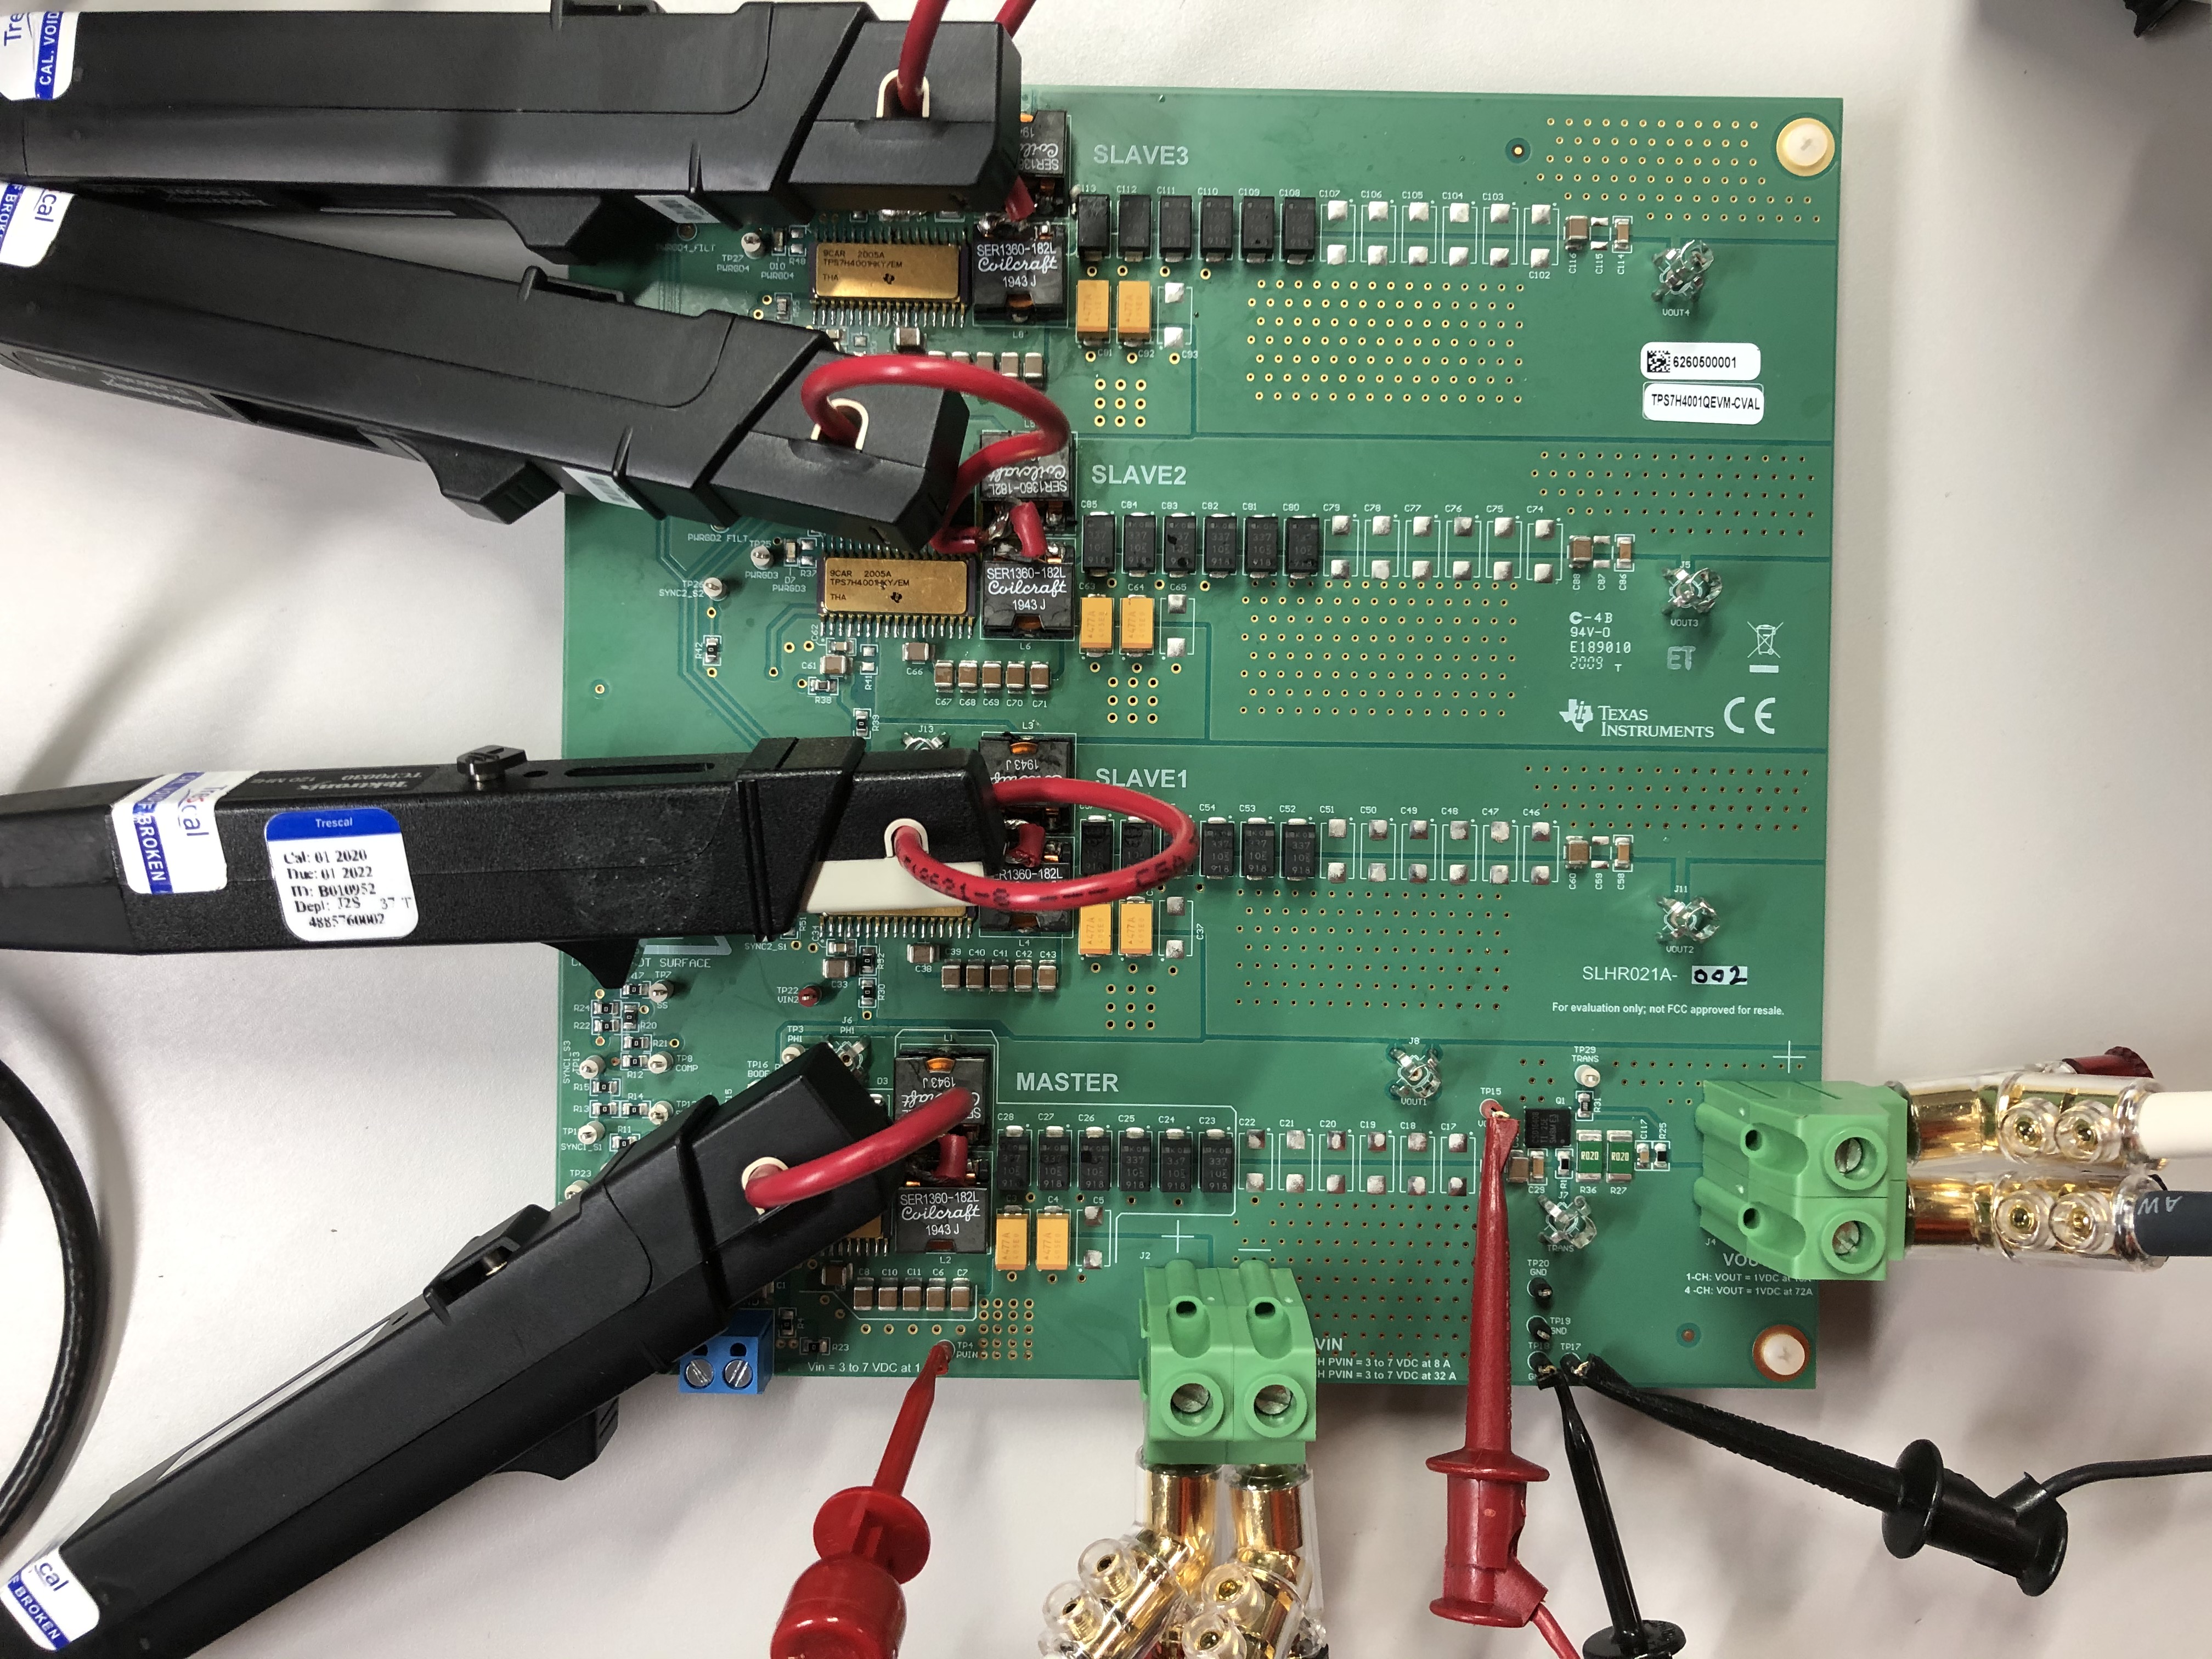
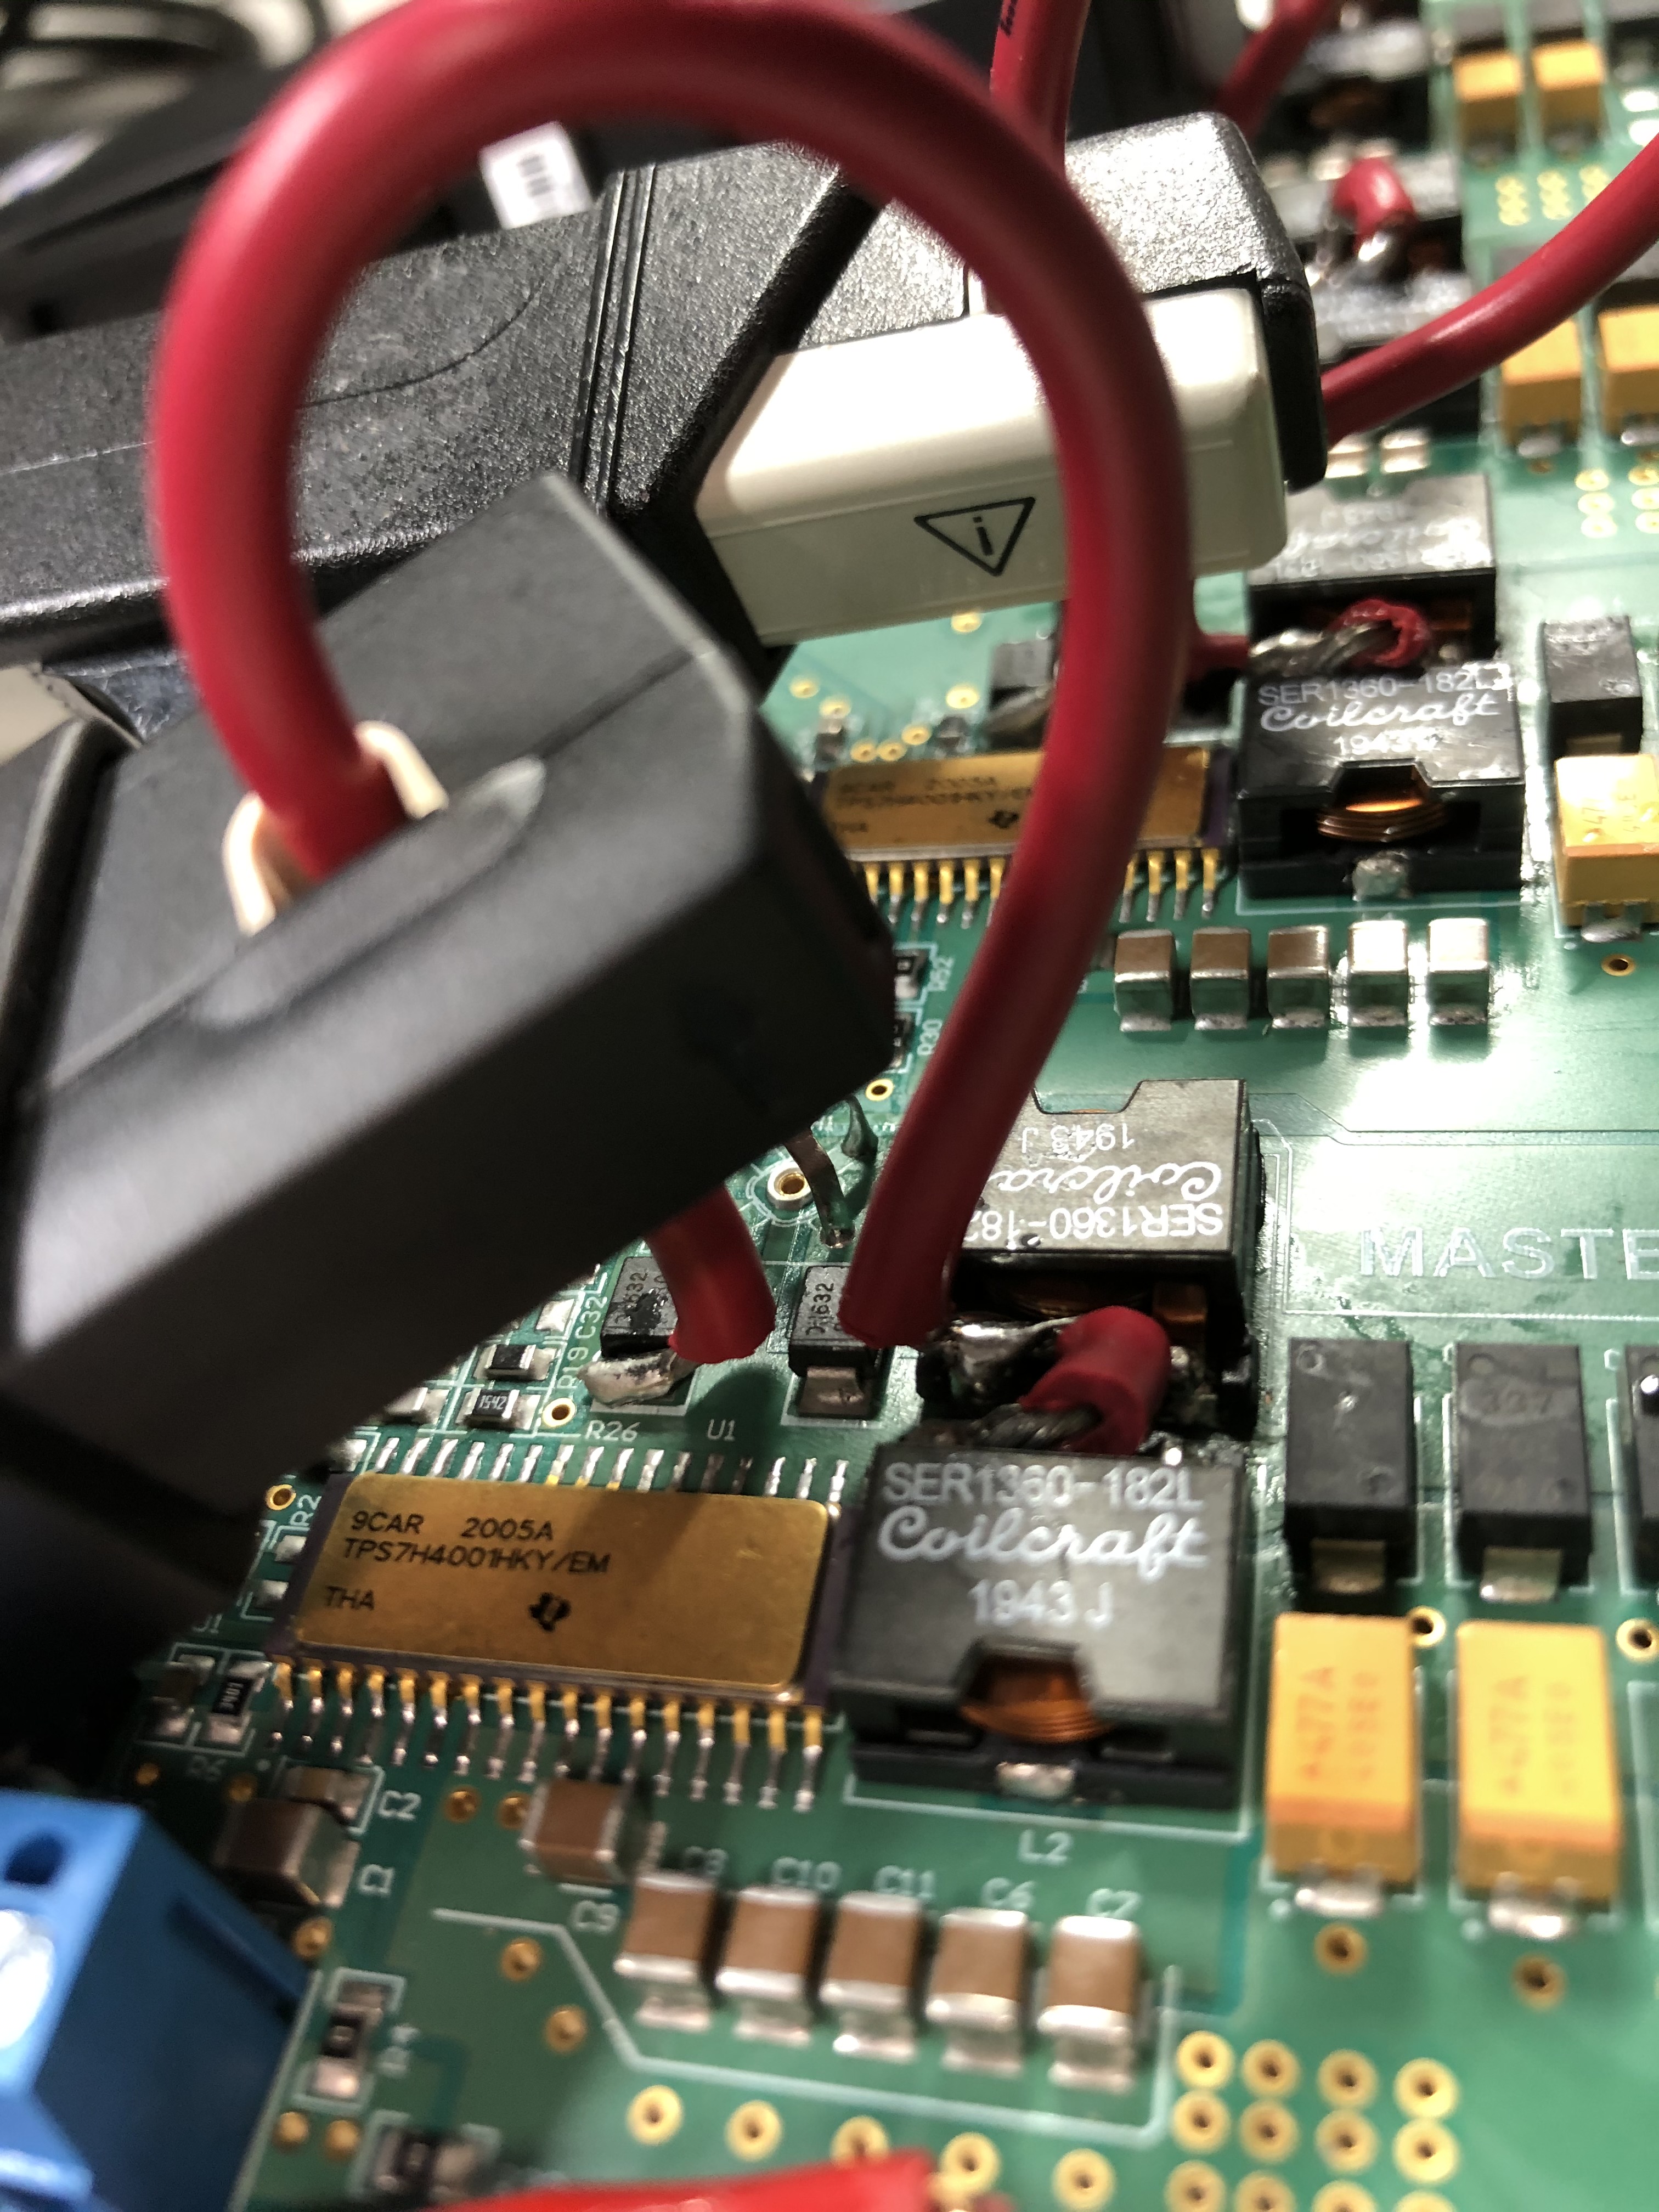
By characterizing a parallel system through measurements, the tolerance window of +/-28% can be greatly reduced allowing for more optimal design. Figure 15 and Figure 16 shows how current sharing on a 4-Channel design was characterized. The EVM was modified to allow for a current probe to measure the current out of each converter by placing a wire between the PHASE node of the DUT and the output inductors.
 Figure 15. Current Sharing Measurement Setup
  Figure 16. Current Sharing Measurement Setup
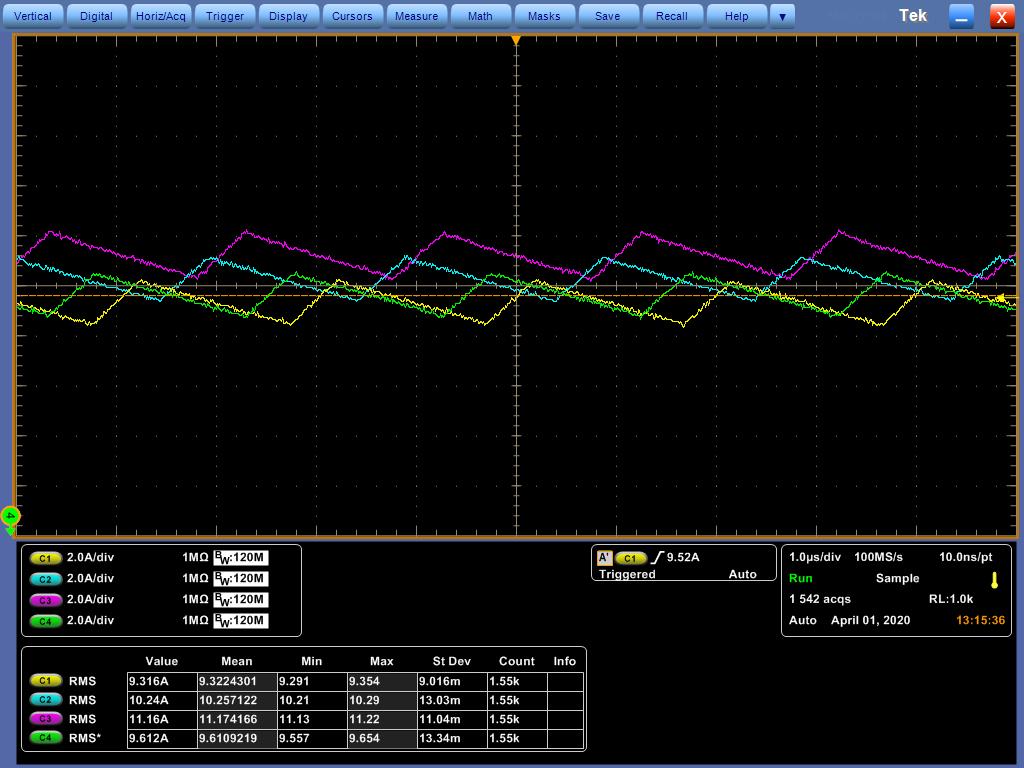
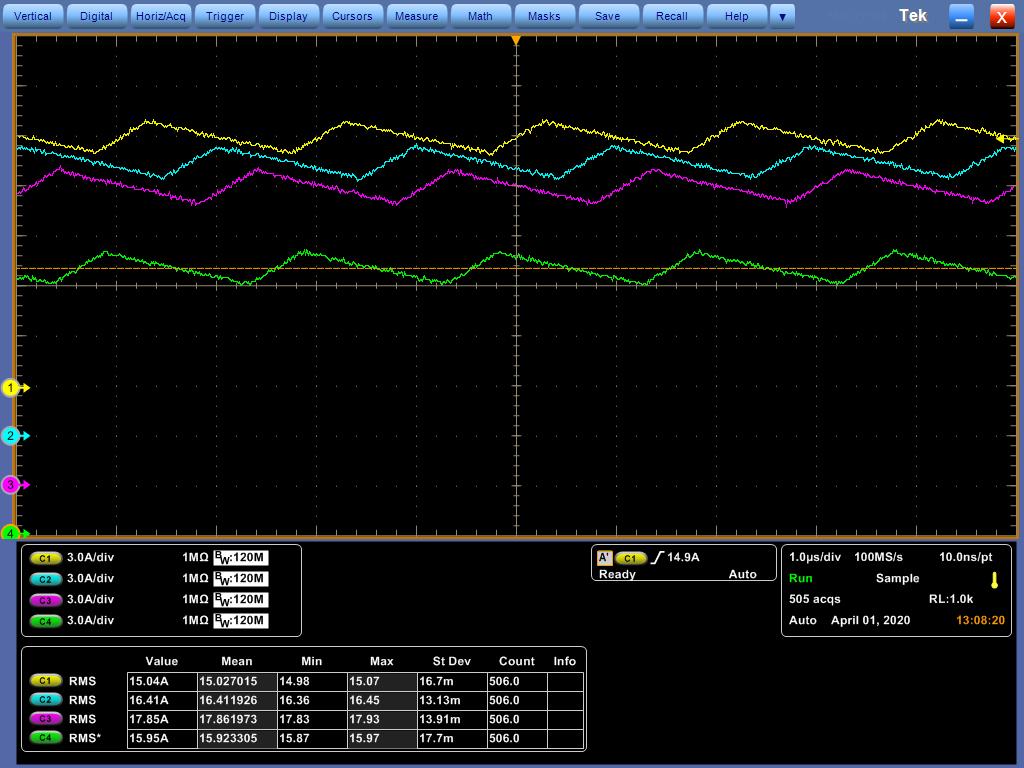
 The RMS currents of each probe were captured and recorded on the oscilloscope as shown in Figure 17 and Figure 18. Figure 17 shows the individual converter currents when the total e-load current was set to 40A while Figure 18 shows the same for an e-load current of 65A.
 Figure 17. Current Sharing 40Amps Total eLoad Current
  Figure 18. Current Sharing 65Amps Total eLoad Current
 Table 3 shows a summary of the measurements for load currents from 15A to 80A. The second column of Table 3 shows the ideal current per converter if matching were perfect. The next four columns show the mean value of current measured for each converter while the last four columns show the deviation from the ideal value as a percentage. It is this data that is invaluable in understanding the true variation within a system. Taking the row in the table for 65A total e-load current as an example, converter SLAVE2 is operating at +9.92% above nominal, while the MASTER converter is operating at -7.53% below nominal current level. With this information, the system can operate at a toal current of 65A while still keeping each converter within the ROC specified, compared to the 39A the design would support assuming worst case for all converters.
Table 3. Current Sharing Data
| Measured Mean Current | Deviation from Ideal (%) | ||||||||
|---|---|---|---|---|---|---|---|---|---|
| Total eLoad Current (Amps) | Perfect match Current per converter (Amps) | MASTER (Amps) | SLAVE1 (Amps) | SLAVE2 (Amps) | SLAVE3 (Amps) | MASTER | SLAVE1 | SLAVE2 | SLAVE3 |
| 15 | 3.75 | 3.48 | 4.16 | 4.47 | 3.15 | -7.17% | 10.87% | 19.12% | -16.07% |
| 20 | 5.00 | 4.66 | 5.37 | 5.80 | 4.44 | -6.83% | 7.38% | 15.93% | -11.17% |
| 25 | 6.25 | 5.81 | 6.60 | 7.16 | 5.72 | -7.08% | 5.52% | 14.50% | -8.55% |
| 30 | 7.50 | 6.99 | 7.82 | 8.50 | 7.01 | -6.81% | 4.23% | 13.33% | -6.55% |
| 35 | 8.75 | 8.14 | 9.06 | 9.85 | 8.33 | -7.01% | 3.55% | 12.62% | -4.76% |
| 40 | 10.00 | 9.32 | 10.26 | 11.17 | 9.61 | -6.78% | 2.57% | 11.74% | -3.89% |
| 45 | 11.25 | 10.47 | 11.47 | 12.51 | 10.85 | -6.91% | 1.98% | 11.24% | -3.55% |
| 50 | 12.50 | 11.65 | 12.72 | 13.86 | 12.14 | -6.82% | 1.77% | 10.91% | -2.84% |
| 55 | 13.75 | 12.84 | 13.96 | 15.19 | 13.44 | -6.47% | 1.56% | 10.48% | -2.23% |
| 60 | 15.00 | 14.03 | 15.19 | 16.50 | 14.74 | -6.47% | 1.24% | 10.03% | -1.75% |
| 65 | 16.25 | 15.03 | 16.41 | 17.86 | 15.92 | -7.53% | 1.00% | 9.92% | -2.01% |
| 70 | 17.50 | 16.22 | 17.61 | 19.21 | 17.21 | -7.32% | 0.63% | 9.77% | -1.66% |
| 80 | 20.00 | 18.63 | 20.14 | 21.69 | 19.82 | -6.83% | 0.69% | 8.46% | -0.92% |