SNAU163C August   2014  – October  2016 FDC1004


  1.   FDC1004EVM User's Guide
    1.     Trademarks
    2. 1 Setup
      1. 1.1 FDC1004EVM
      2. 1.2 Input/Output Connector Description
      3. 1.3 HW Setup
    3. 2 Sensing Solutions EVM GUI
      1. 2.1 System Requirements
      2. 2.2 Installation Instructions
      3. 2.3 Starting the GUI
      4. 2.4 Navigating the GUI
      5. 2.5 Connecting the EVM
      6. 2.6 Configuring the EVM Using the Register Page
        1. 2.6.1 Automatically Update GUI Register Values Using Auto-Read
        2. 2.6.2 Manually Update Device Register Values
        3. 2.6.3 Reading Register Values without Auto-Read
        4. 2.6.4 Saving Device Configurations
        5. 2.6.5 Loading Previously Saved Configurations
      7. 2.7 Configuring the EVM Using the Configuration Page
      8. 2.8 Streaming Measurement Data
        1. 2.8.1 Choosing the Graph and Visible Channels
        2. 2.8.2 Logging Data to a File
        3. 2.8.3 Starting and Stopping Data Streaming
        4. 2.8.4 Data Statistics
        5. 2.8.5 Configuring the Graph
        6. 2.8.6 Navigating the Data Streaming Buffer
      9. 2.9 Updating the EVM Firmware
    4. 3 Board Layout
    5. 4 Schematic
  2.   Revision History

Choosing the Graph and Visible Channels

Select the drop down menu on top of the y-axis to choose the graph to display.
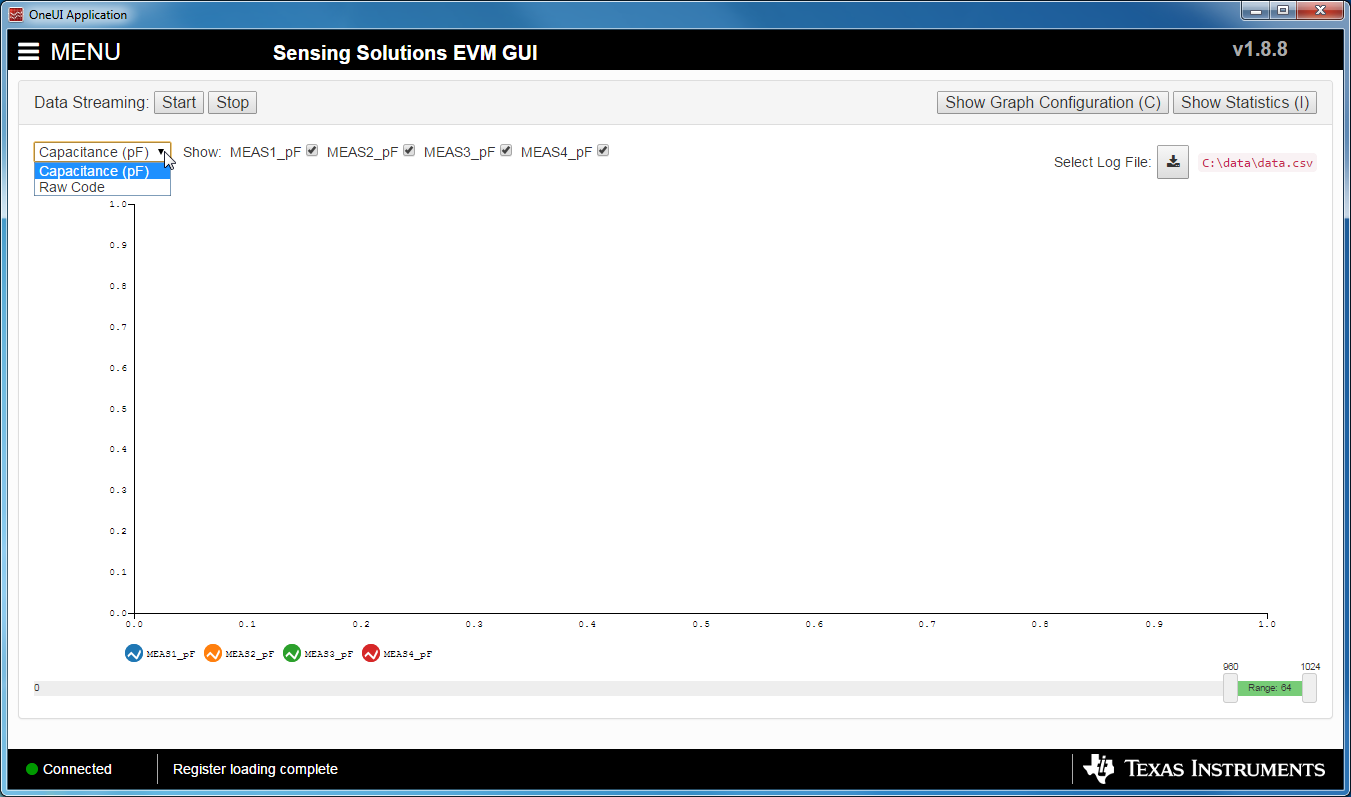
6_gui_streaming_00_fdc1004_stream_select_graph.pngFigure 25. Select the Data Graph on Data Streaming Page

To select which channel measurements are displayed in the graph, check or uncheck the available channels shown next to the graph units. Selecting or not selecting the channels only affects the graph and not the data logged to a file. If a channel is not enabled in the Configuration page it will not appear on the Data Streaming page.