SNAU274 December 2021
3.2 Time Domain
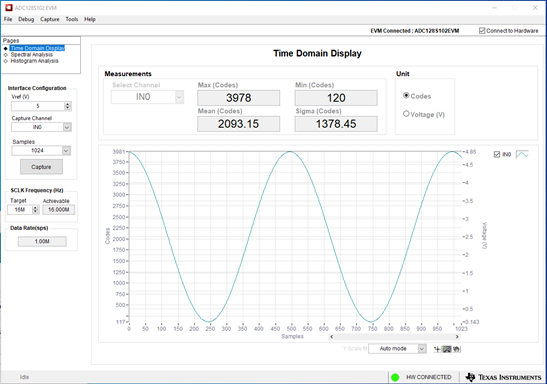
The time domain display page (as shown in Figure 3-2) displays the data captured in the time domain. Data are displayed in both codes or voltage, based on the voltage selected in the Vref (V) drop down.
In the Measurements box above the graph, user configuration options and measurements are available. If all channels are sampled, the drop down box provides an option to change the respective channel measurement data to be displayed.
 Figure 3-2 Time Domain Display