SNOA951 June 2016 LDC1312 , LDC1312-Q1 , LDC1314 , LDC1314-Q1 , LDC1612 , LDC1612-Q1 , LDC1614 , LDC1614-Q1
- Inductive Sensing Touch-On-Metal Buttons Design Guide
4 Results
Figure 21 shows the real-time output response when pressing the buttons with a finger. The LDC output is repeatable and button presses do not cause significant interference. A configurable threshold is added in software to detect button press events. More sophisticated software algorithms can also be applied to add functionality such as multi-button support and multi-level force sensitivity, and to remove unwanted effects which are caused by drastic changes in temperature or humidity, or permanent deformation of the metal. These algorithms can be run on ultra-low power microcontrollers such as an MSP430.
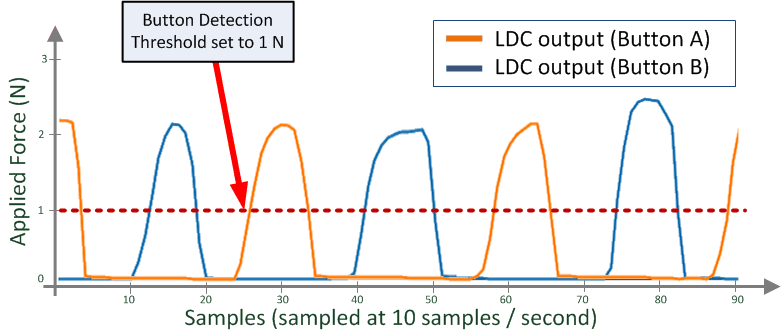 Figure 21. Real-Time Button Response Output
 The buttons can be characterized by measuring the output response while different amounts of force are applied to the center of the button.
Figure 22 shows the measurement data of the average metal deflection for the panel. From the data, it can be seen that deflections as high as 15 µm can be achieved with as little as 1 N of force, which represents a light button press.
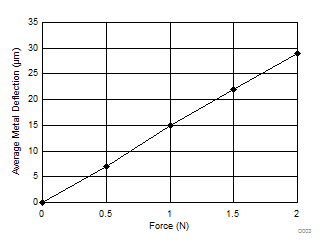 Figure 22. Force vs Metal Deflection (Button A)
 Figure 23 shows that applying 1 N of force to Button A results in an clearly detectable inductance change of -1.07%.
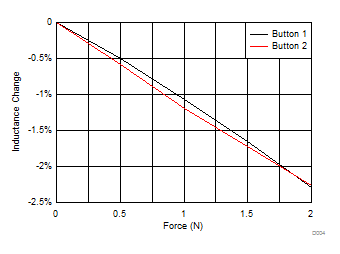 Figure 23. Applied Force vs Sensor Frequency Change
 Figure 24 shows how small the mechanical crosstalk is between the two buttons. Due to the mechanical structure of the panel, the output reading in button B moves by 0.03% into the opposite direction. In systems with poor mechanical isolation this opposite response could be larger, which could represent a problem when the metal relaxes making it look like a button press. As long as the amount of opposite deflection is less than button detection threshold it will not trigger a button press. This can be achieved when following the guidelines detailed in this report.
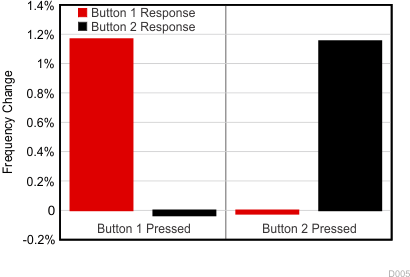 Figure 24. Isolation Between Button A and Button B (1-N Force)
 To calculate the SNR, Equation 2 is used.

Even at a very light button press of 0.5 N of force, the signal-to-noise ratio exceeds 47 dB, as shown in Figure 25. This SNR is much higher than the recommended minimum SNR of 20 dB, which is required by simple software algorithms to reliably detect button presses.
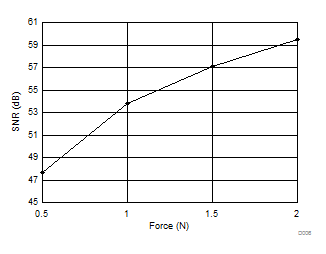 Figure 25. Signal-to-Noise Ratio