SNOA952 May 2016 FDC2112 , FDC2112-Q1 , FDC2114 , FDC2114-Q1 , FDC2212 , FDC2212-Q1 , FDC2214 , FDC2214-Q1
3 Qualitative Test Setup
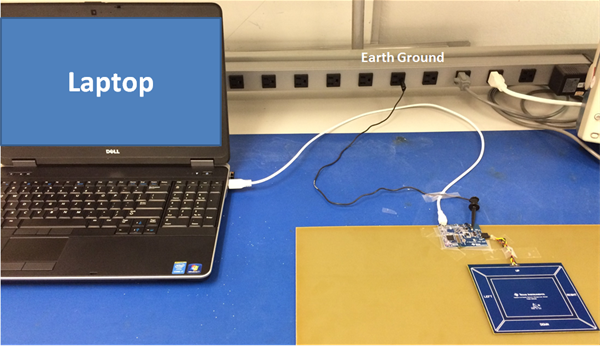
This next section, Section 3, presents experiments that qualitatively illustrate the ground shift phenomenon. Figure 4 shows the test setup consisting of an FDC2214 EVM with the standard sensors replaced by a custom bezel-shaped sensor, a USB cable, and a laptop. The FDC2214 EVM is connected to the laptop through the USB (for power and data streaming) and various system grounding configurations are tested to illustrate the ground shift phenomenon. Table 1 shows the device configurations. Figure 4 and Figure 5 show the test measurement setup. The customized bezel sensor area is 55.8 cm2 and all proximity detections are measured with a hand approaching within 10 cm of the sensor.
Table 1. Testing Conditions and Device Configuration Settings
| CH0 | |
|---|---|
| Proximity Detection | 10 cm |
| Deglitch Filter | 10 MHz |
| Sensor Frequency | 4 to 5 MHz |
| Measurement Sequence | Continuous Single Channel |
| External Reference Frequency | 40 MHz |
| RCOUNT | 65535 |
| IDRIVE | 196 µA |
 Figure 4. Test Setup: an Outlet Connects to Earth Ground When Needed and a Large Local Ground Plane is Nearby for Connection When Needed
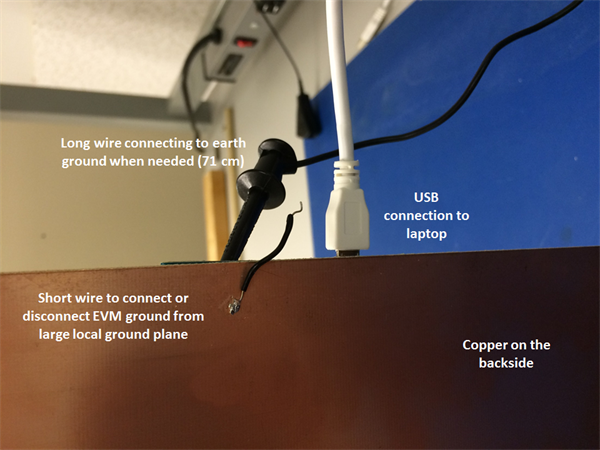
  Figure 5. The Ground Plate Has Copper on the Backside (Seen Here) and FR-4 on the Topside (Seen in Figure 4)
 The white USB cable connects the FDC2214 EVM directly to the laptop, and the black cable allows the ground of the EVM to connect or disconnect from the ground plane. Figure 4 shows how the long black cable can also connect to earth ground or be left disconnected, leaving the system floating. A short black wire is soldered onto the copper side of the ground plane allowing it to be either connected or disconnected from the FDC2214 EVM ground (Figure 5).