SNOAA62B February 2023 – October 2024 LMP7704-SP
5 SEL Results
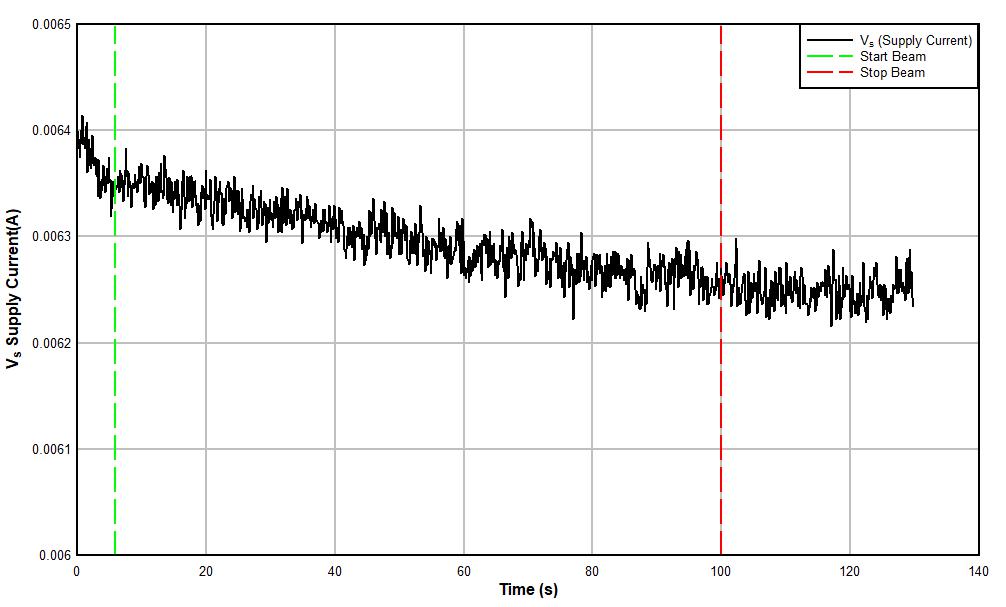
During SEL characterization, the device was heated using forced hot air, maintaining the IC temperature at 125°C. The temperature was monitored by means of a K-type thermocouple attached as close to the IC as possible. The species used for the SEL testing was a Praseodymium (59Pr) ion with an angle-of-incidence of 39° for an LETEFF = 85MeV-cm2/mg. The kinetic energy in the vacuum for this ion is 2.114GeV (15-MeV/amu line). A flux of approximately 105 ions/s-cm2 and a fluence of approximately 107 ions/cm2 were used for two runs. The VS supply voltage is supplied externally onboard at the recommended maximum voltage setting of 12V. Run duration to achieve this fluence was approximately 2 minutes. No SEL events were observed during both runs shown in Table 5-1. Figure 5-1 shows a plot of the current vs time.
| RUN # | DISTANCE (mm) |
TEMPERATURE (°C) |
ION | ANGLE | FLUX (ions/s-cm2) |
FLUENCE (ions/cm2) |
LETEFF
(MeV-cm2/mg) |
|---|---|---|---|---|---|---|---|
| 10 | 40 | 125 |
Pr |
39° | 1.00E+05 | 1.00E+07 |
85 |
|
311 |
40 |
125 |
Pr |
39° | 1.00E+05 | 1.00E+07 |
85 |
No SEL events were observed, indicating that the LMP7704-SP is SEL-immune at LETEFF = 85MeV-cm2/mg and T = 125°C. Using the MFTF method described in Appendix A and combining (or summing) the fluences of the two runs at 125°C (2 × 10⁷ ions/cm2), the upper-bound cross-section (using a 95% confidence level) is calculated in Equation 1:
 Figure 5-1 Current Versus Time (I vs t) Data for
VS Current During SEL Run # 10