SNOAA62B February 2023 – October 2024 LMP7704-SP
6 SET Results
The LMP7704-SP was characterized for SETs from 2 to 85MeV-cm2/mg. Table 6-2 lists the ions used for the testing.The device was tested at room temperature in a buffer configuration with the four different setups show in Table 6-1. A flux of 104 ions/s-cm2 was used for all SET runs. The SETs discussed in this report were defined as output voltages that exceeded a window trigger of 5% from the expected output. Both positive and negative upsets were observed during the testing.
| Configuration | Gain | Power Supply (±V) | Input (V) | Expected Output (V) | Trigger Window (V) |
|---|---|---|---|---|---|
|
1 |
1 |
1.35 |
1 |
1 |
0.95 to 1.05 |
|
2 |
6 |
2 |
2 |
1.9 to 2.1 |
|
|
3 |
10 |
1.35 |
0.1 |
1 |
0.95 to 1.05 |
|
4 |
6 |
0.2 |
2 |
1.9 to 2.1 |
| LETEFF (MeV-cm2/mg) | Ion | Angle (Degree) |
|---|---|---|
|
85 |
Ho |
25.5 |
|
75 |
Ho |
0 |
|
72 |
Pr |
25.5 |
|
65 |
Pr |
0 |
|
54 |
Ag |
25.5 |
|
48 |
Ag |
0 |
|
23 |
Cu |
25.5 |
|
9 |
Ar |
0 |
|
2 |
Ne |
0 |
The number of events observed during the heavy ion runs are presented in Table 6-3 to Table 6-6. All four channels were monitored during the heavy ion runs. LMP7704-SP was tested to fluences ranging from 106 to 2 × 10⁶ ions/cm2.
|
LETEFF (MeV-cm2/mg) |
Fluence (ions/cm2) |
Ch1 |
Ch2 |
Ch3 |
Ch4 |
||||
|---|---|---|---|---|---|---|---|---|---|
|
# of Events |
Cross Section (cm2) |
# of Events | Cross Section (cm2) | # of Events | Cross Section (cm2) | # of Events | Cross Section (cm2) | ||
|
85 |
9.96E+05 |
28 |
2.81E-05 |
252 |
2.53E-04 |
248 |
2.49E-04 |
45 |
4.52E-05 |
|
75 |
1.00E+06 |
20 |
2.00E-05 |
248 |
2.48E-04 |
194 |
1.94E-04 |
40 |
4.00E-05 |
|
72 |
1.01E+06 |
23 |
2.29E-05 |
17 |
1.69E-05 |
4 |
3.98E-06 |
4 |
3.98E-06 |
|
65 |
9.70E+05 |
18 |
1.86E-05 |
13 |
1.34E-05 |
6 |
6.19E-06 |
20 |
2.06E-05 |
|
54 |
2.00E+06 |
20 |
1.00E-05 |
17 |
8.52E-06 |
7 |
3.51E-06 |
26 |
1.30E-05 |
|
48 |
1.99E+06 |
16 |
8.04E-06 |
14 |
7.04E-06 |
10 |
5.03E-06 |
17 |
8.54E-06 |
|
23 |
2.00E+06 |
0 |
0.00E+00 |
0 |
0.00E+00 |
0 |
0.00E+00 |
1 |
4.99E-07 |
|
9 |
1.99E+06 |
1 |
5.03E-07 |
0 |
0.00E+00 |
0 |
0.00E+00 |
1 |
5.03E-07 |
|
2 |
2.00E+06 |
1 |
5.00E-07 |
0 |
0.00E+00 |
0 |
0.00E+00 |
2 |
1.00E-06 |
|
LETEFF (MeV-cm2/mg) |
Fluence (ions/cm2) |
Ch1 |
Ch2 |
Ch3 |
Ch4 |
||||
|---|---|---|---|---|---|---|---|---|---|
| # of Events | Cross Section (cm2) | # of Events | Cross Section (cm2) | # of Events | Cross Section (cm2) | # of Events | Cross Section (cm2) | ||
|
85 |
1.00E+06 |
14 |
1.40E-06 |
67 |
6.70E-05 |
41 |
4.10E-05 |
28 |
2.80E-05 |
|
75 |
1.00E+06 |
16 |
1.60E-06 |
53 |
5.30E-05 |
59 |
5.90E-05 |
11 |
1.10E-05 |
|
72 |
1.00E+06 |
14 |
1.40E-06 |
15 |
1.50E-05 |
10 |
9.97E-06 |
13 |
1.30E-05 |
|
65 |
9.80E+05 |
13 |
1.33E-05 |
11 |
1.12E-05 |
20 |
2.04E-05 |
12 |
1.22E-05 |
|
54 |
2.00E+06 |
21 |
1.05E-05 |
17 |
8.50E-06 |
16 |
8.00E-06 |
18 |
9.00E-06 |
|
48 |
2.00E+06 |
21 |
1.05E-05 |
24 |
1.20E-05 |
10 |
5.00E-06 |
18 |
9.00E-06 |
|
23 |
2.00E+06 |
2 |
1.00E-06 |
0 |
0.00E+00 |
0 |
0.00E+00 |
6 |
3.01E-06 |
|
9 |
1.99E+06 |
0 |
0.00E+00 |
0 |
0.00E+00 |
0 |
0.00E+00 |
0 |
0.00E+00 |
|
2 |
1.99E+06 |
0 |
0.00E+00 |
0 |
0.00E+00 |
0 |
0.00E+00 |
0 |
0.00E+00 |
|
LETEFF (MeV-cm2/mg) |
Fluence (ions/cm2) |
Ch1 |
Ch2 |
Ch3 |
Ch4 |
||||
|---|---|---|---|---|---|---|---|---|---|
|
# of Events |
Cross Section (cm2) |
# of Events | Cross Section (cm2) | # of Events | Cross Section (cm2) | # of Events | Cross Section (cm2) | ||
|
85 |
1.01E+06 |
253 |
2.50E-04 |
214 |
2.12E-04 |
187 |
1.85E-04 |
288 |
2.85E-04 |
|
75 |
9.99E+05 |
175 |
1.75E-04 |
200 |
2.00E-04 |
145 |
1.45E-04 |
211 |
2.11E-04 |
|
72 |
9.68E+05 |
153 |
1.58E-04 |
154 |
1.59E-04 |
113 |
1.17E-04 |
209 |
2.16E-04 |
|
65 |
1.00E+06 |
101 |
1.01E-04 |
95 |
9.50E-05 |
72 |
7.20E-05 |
163 |
1.63E-04 |
|
54 |
2.00E+06 |
74 |
3.70E-05 |
81 |
4.05E-05 |
45 |
2.25E-05 |
124 |
6.20E-05 |
|
48 |
2.00E+06 |
61 |
3.06E-05 |
53 |
2.66E-05 |
32 |
1.60E-05 |
100 |
5.01E-05 |
|
23 |
2.00E+06 |
8 |
4.00E-06 |
15 |
7.50E-06 |
1 |
5.00E-07 |
21 |
1.05E-05 |
|
9 |
1.99E+06 |
0 |
0.00E+00 |
0 |
0.00E+00 |
0 |
0.00E+00 |
2 |
1.01E-06 |
|
2 |
1.99E+06 |
0 |
00.00E+00 |
0 |
0.00E+00 |
0 |
0.00E+00 |
0 |
0.00E+00 |
|
LETEFF (MeV-cm2/mg) |
Fluence (ions/cm2) |
Ch1 |
Ch2 |
Ch3 |
Ch4 |
||||
|---|---|---|---|---|---|---|---|---|---|
|
# of Events |
Cross Section (cm2) |
# of Events | Cross Section (cm2) | # of Events | Cross Section (cm2) | # of Events | Cross Section (cm2) | ||
|
85 |
1.03E+06 |
22 |
2.14E-05 |
32 |
3.11E-05 |
20 |
1.94E-05 |
38 |
3.69E-05 |
|
75 |
9.97E+05 |
27 |
2.71E-05 |
20 |
2.01E-05 |
27 |
2.71E-05 |
34 |
3.41E-05 |
|
72 |
1.20E+06 |
22 |
1.83E-05 |
19 |
1.58E-05 |
24 |
1.99E-05 |
35 |
2.91E-05 |
|
65 |
1.00E+06 |
19 |
1.90E-05 |
14 |
1.40E-05 |
27 |
2.70E-05 |
30 |
3.00E-05 |
|
54 |
2.00E+06 |
31 |
1.55E-05 |
19 |
9.51E-06 |
38 |
1.90E-05 |
65 |
3.25E-05 |
|
48 |
2.00E+06 |
27 |
1.35E-05 |
19 |
9.50E-06 |
21 |
1.05E-05 |
27 |
1.35E-05 |
|
23 |
2.00E+06 |
2 |
1.00E-06 |
0 |
0.00E+00 |
1 |
5.00E-07 |
2 |
1.00E-06 |
|
9 |
2.00E+06 |
0 |
0.00E+00 |
0 |
0.00E+00 |
0 |
0.00E+00 |
2 |
1.00E-06 |
|
2 |
1.99E+06 |
0 |
0.00E+00 |
0 |
0.00E+00 |
0 |
0.00E+00 |
0 |
0.00E+00 |
Figure 6-1 to Figure 6-8 show the worst-case positive and negative transients at 85MeV-cm2/mg for each test configuration. Importantly, no SETs were observed that reached the voltage supply levels.
When testing with VS = ±1.35V, Gain = 1, the worst-case positive transient occurred on channel 2 and reached a peak value of 1.189V. The event lasted 1.2µs. The worst-case negative transient occurred on channel 1 and reached a peak value of 0.79V. The event lasted 0.39µs.
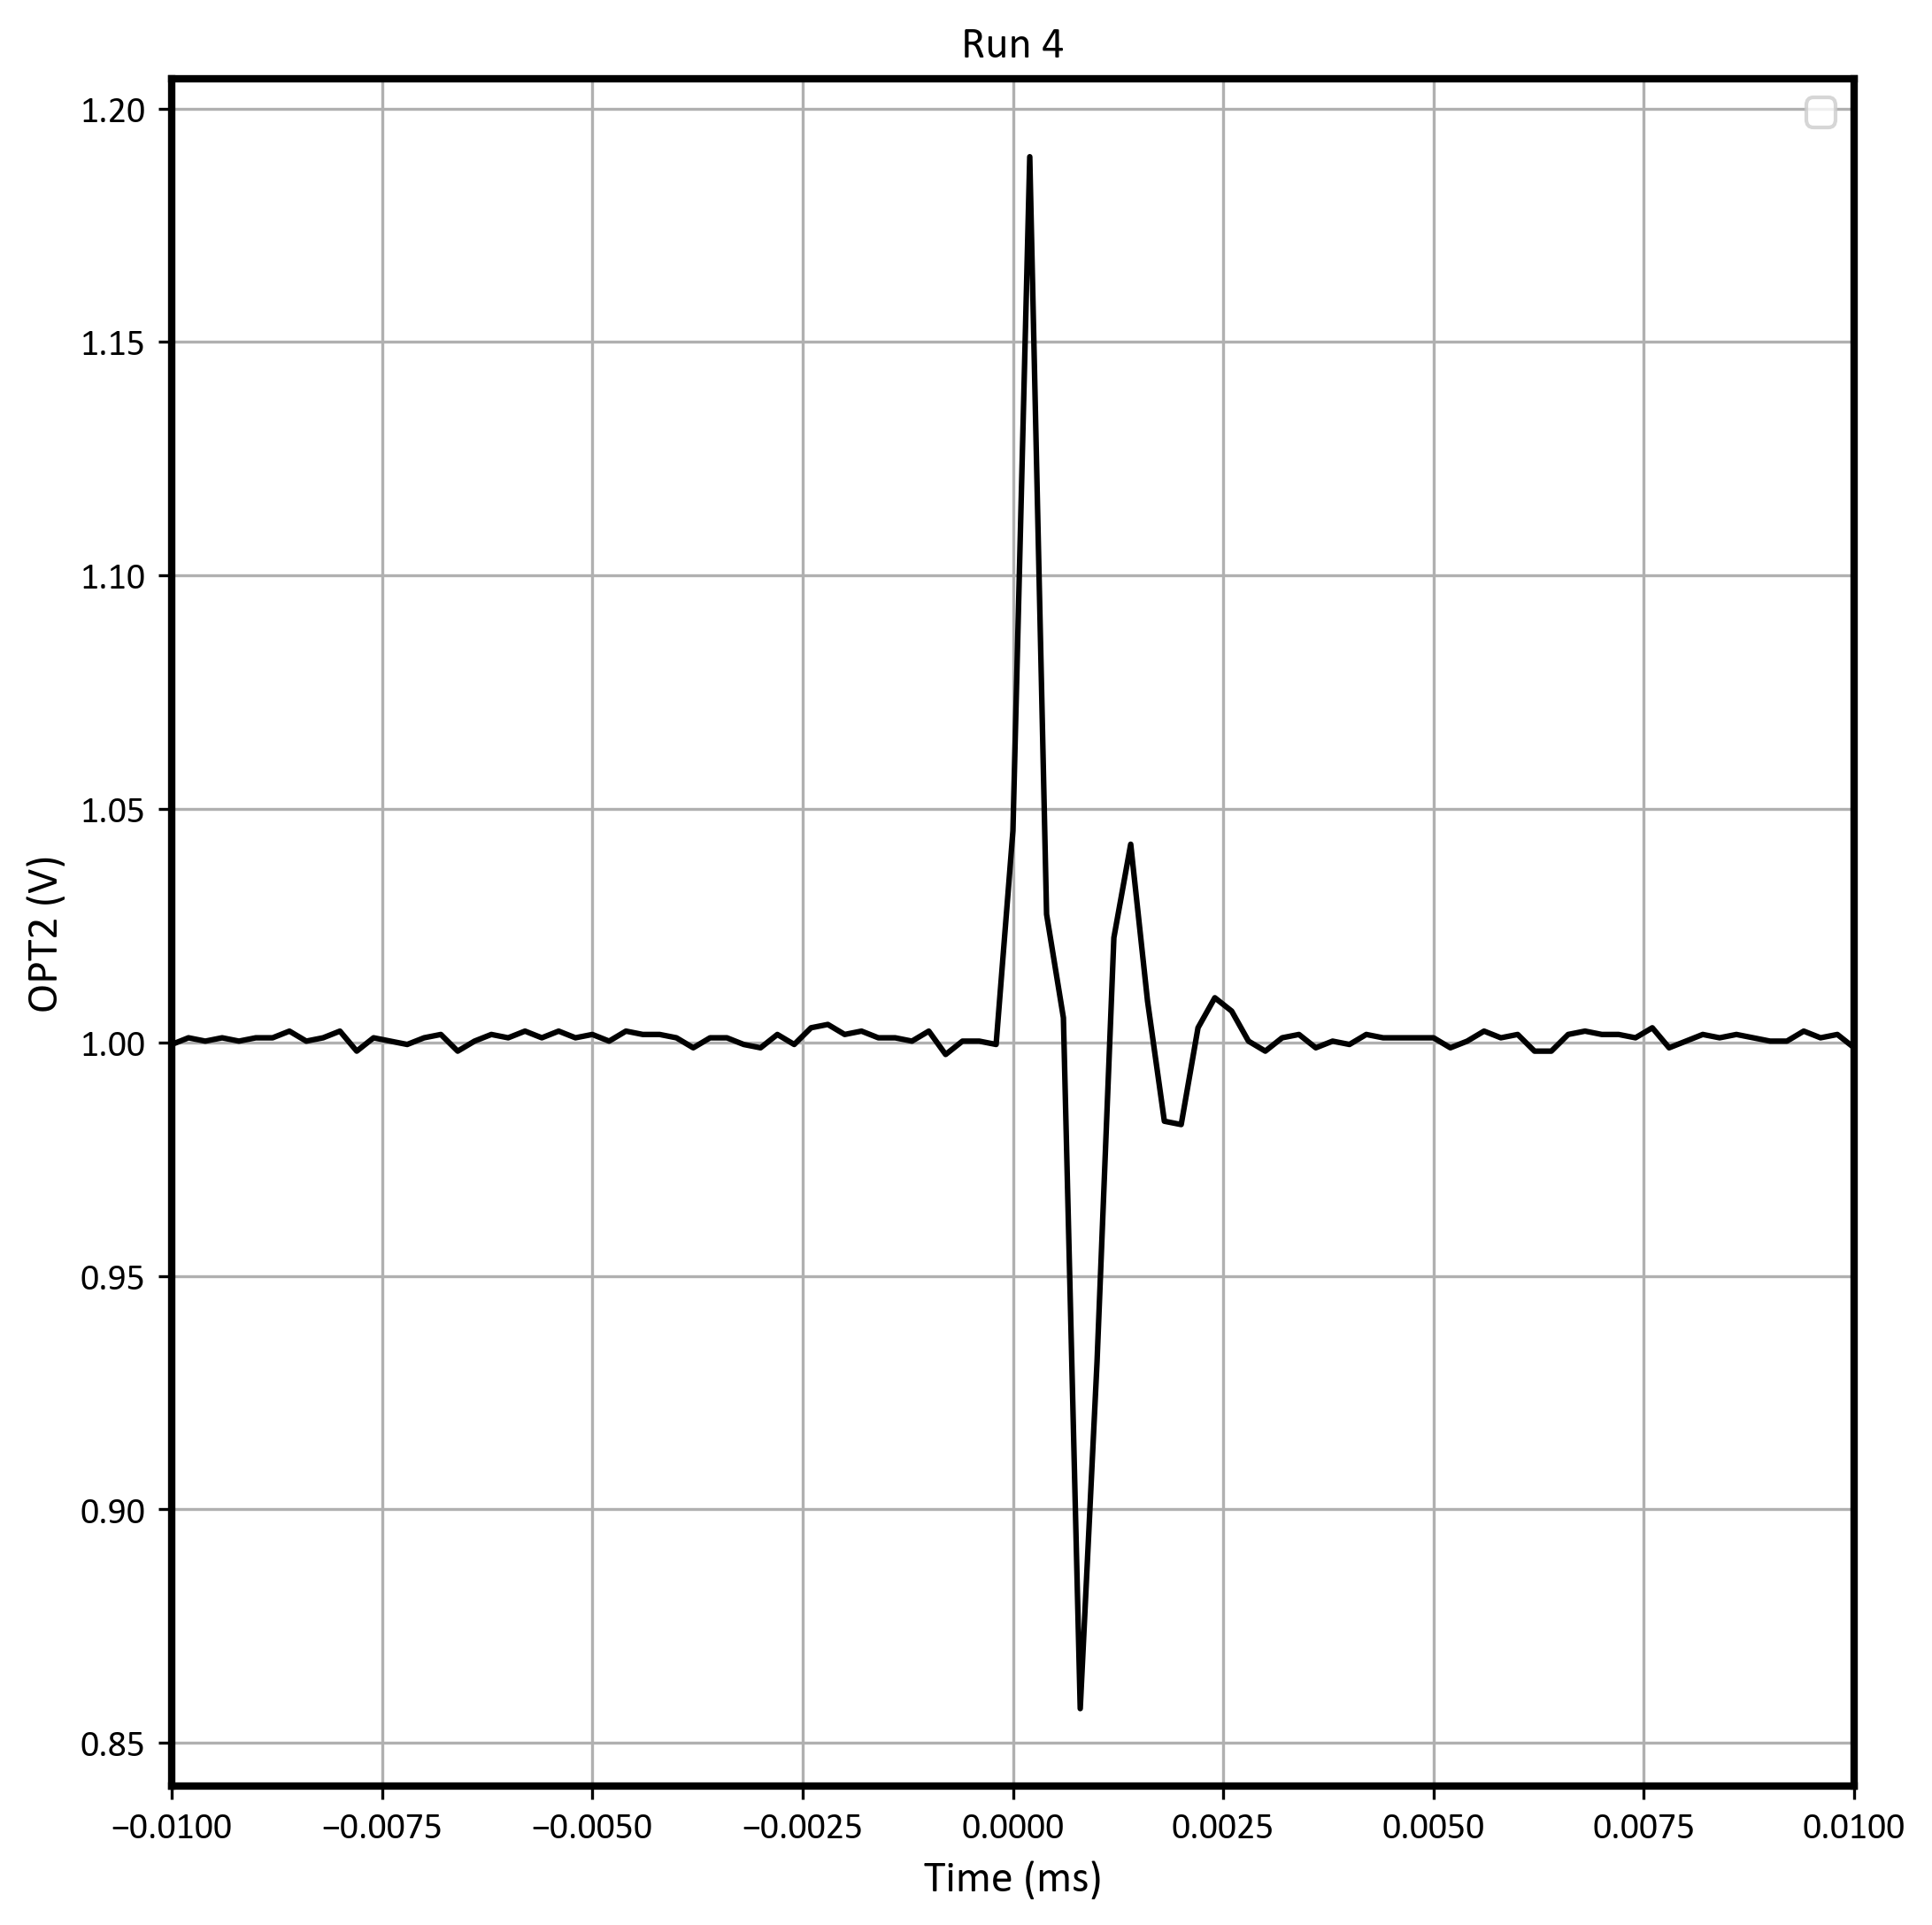 Figure 6-1 Worst-Case Positive
Transient on Run #4 With VS = ±1.35V, Gain = 1
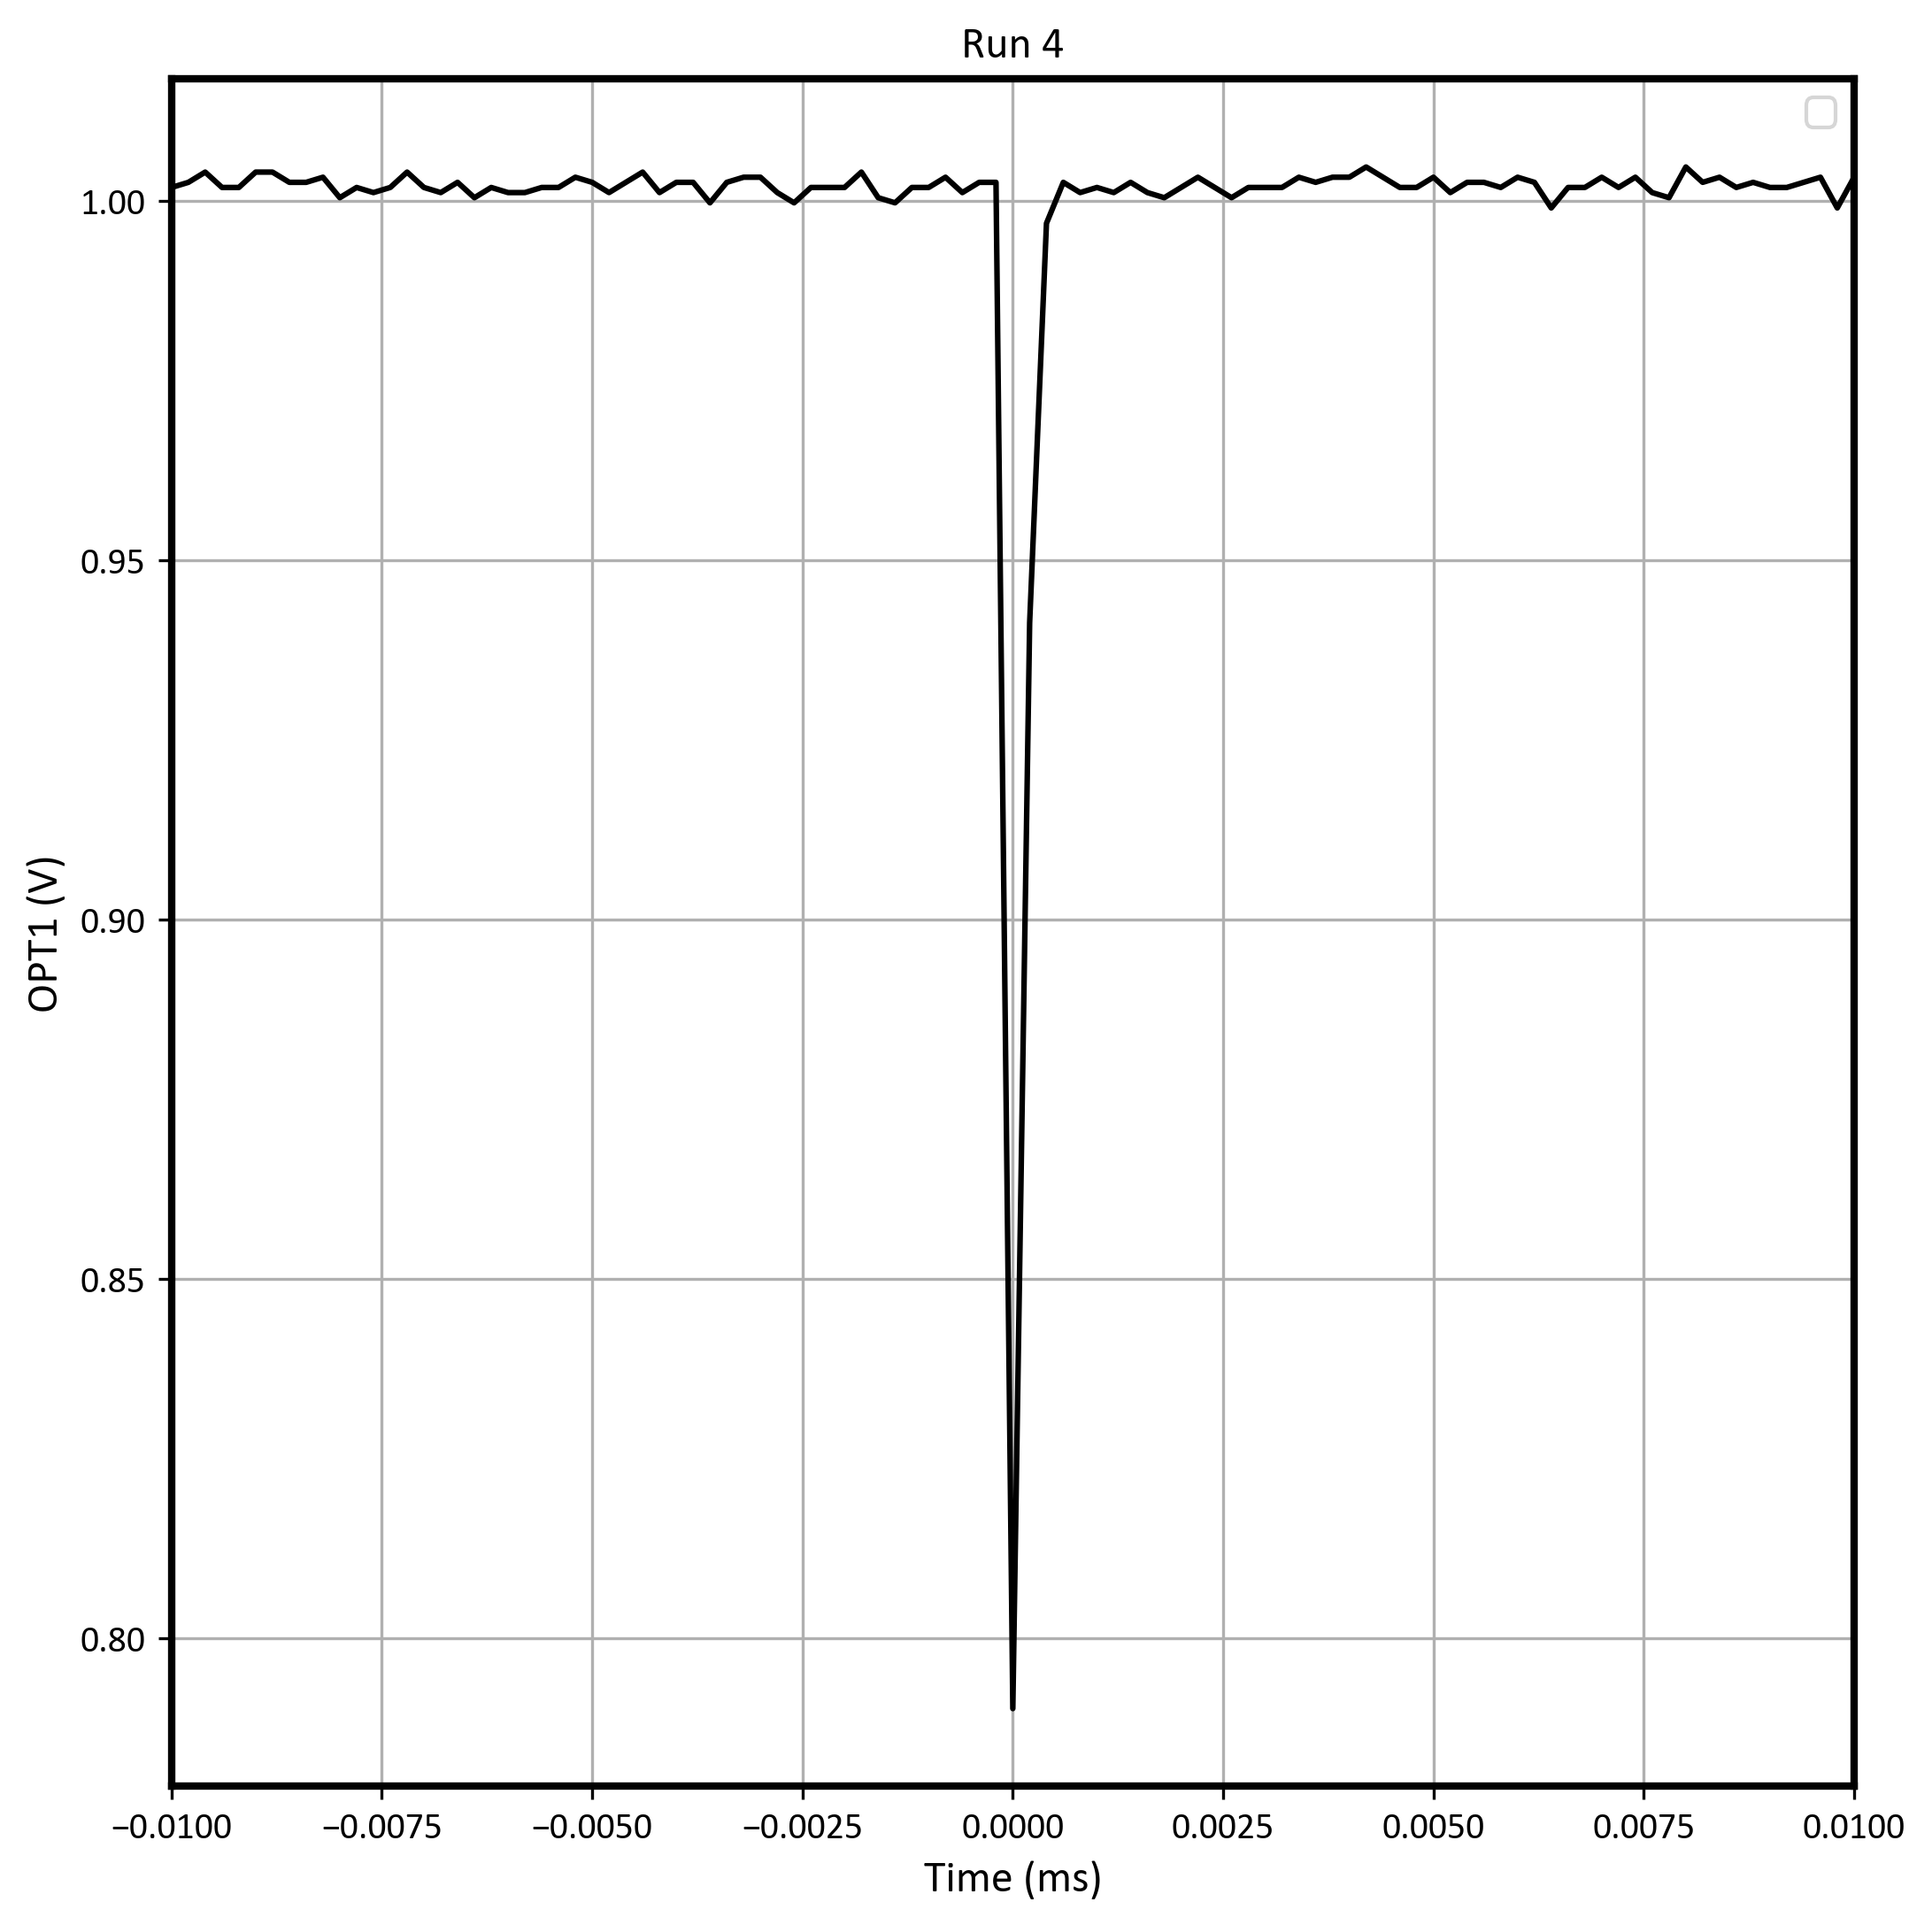 Figure 6-2 Worst-Case Negative
Transient on Run #4 With VS = ±1.35V, Gain = 1
Figure 6-2 Worst-Case Negative
Transient on Run #4 With VS = ±1.35V, Gain = 1When testing with VS = ±6V, Gain = 1, the worst-case positive transient occurred on channel 2 and reached a peak value of 2.34V. The event lasted 0.81µs. The worst-case negative transient occurred on channel 4 and reached a peak value of 1.62V. The event lasted 0.39µs.
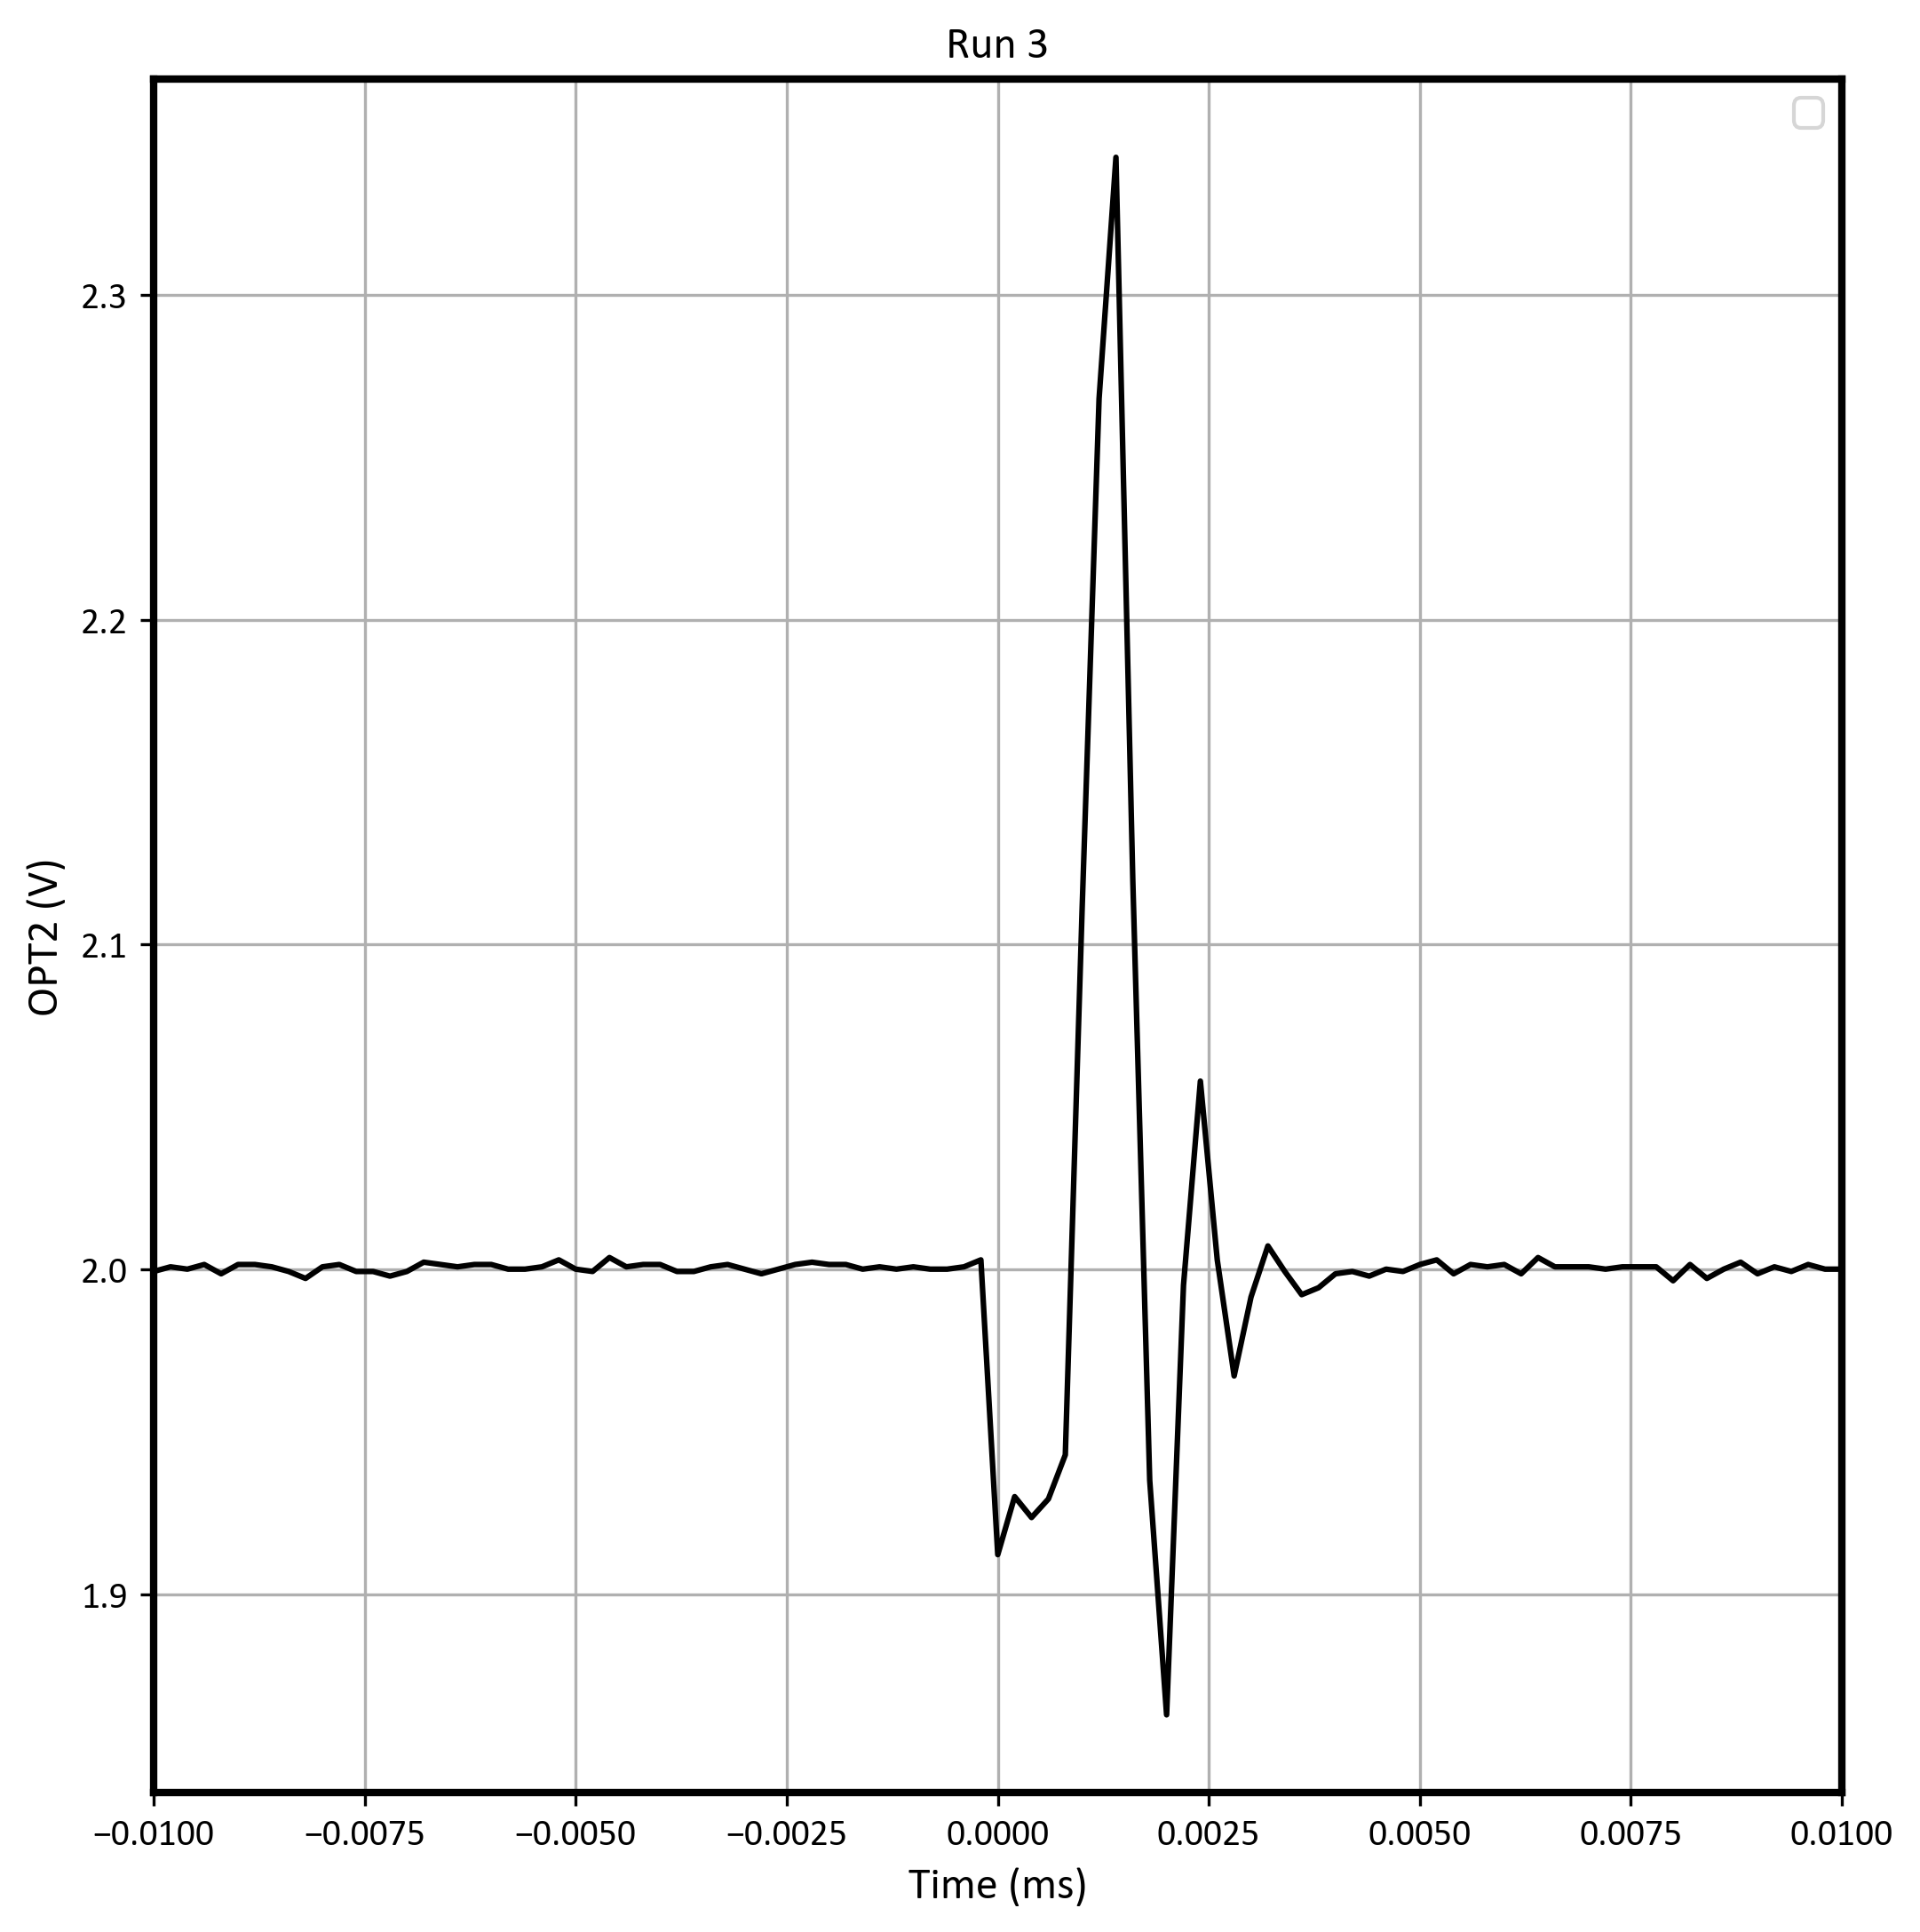 Figure 6-3 Worst-Case Positive
Transient on Run #3 With VS = ±6V, Gain = 1
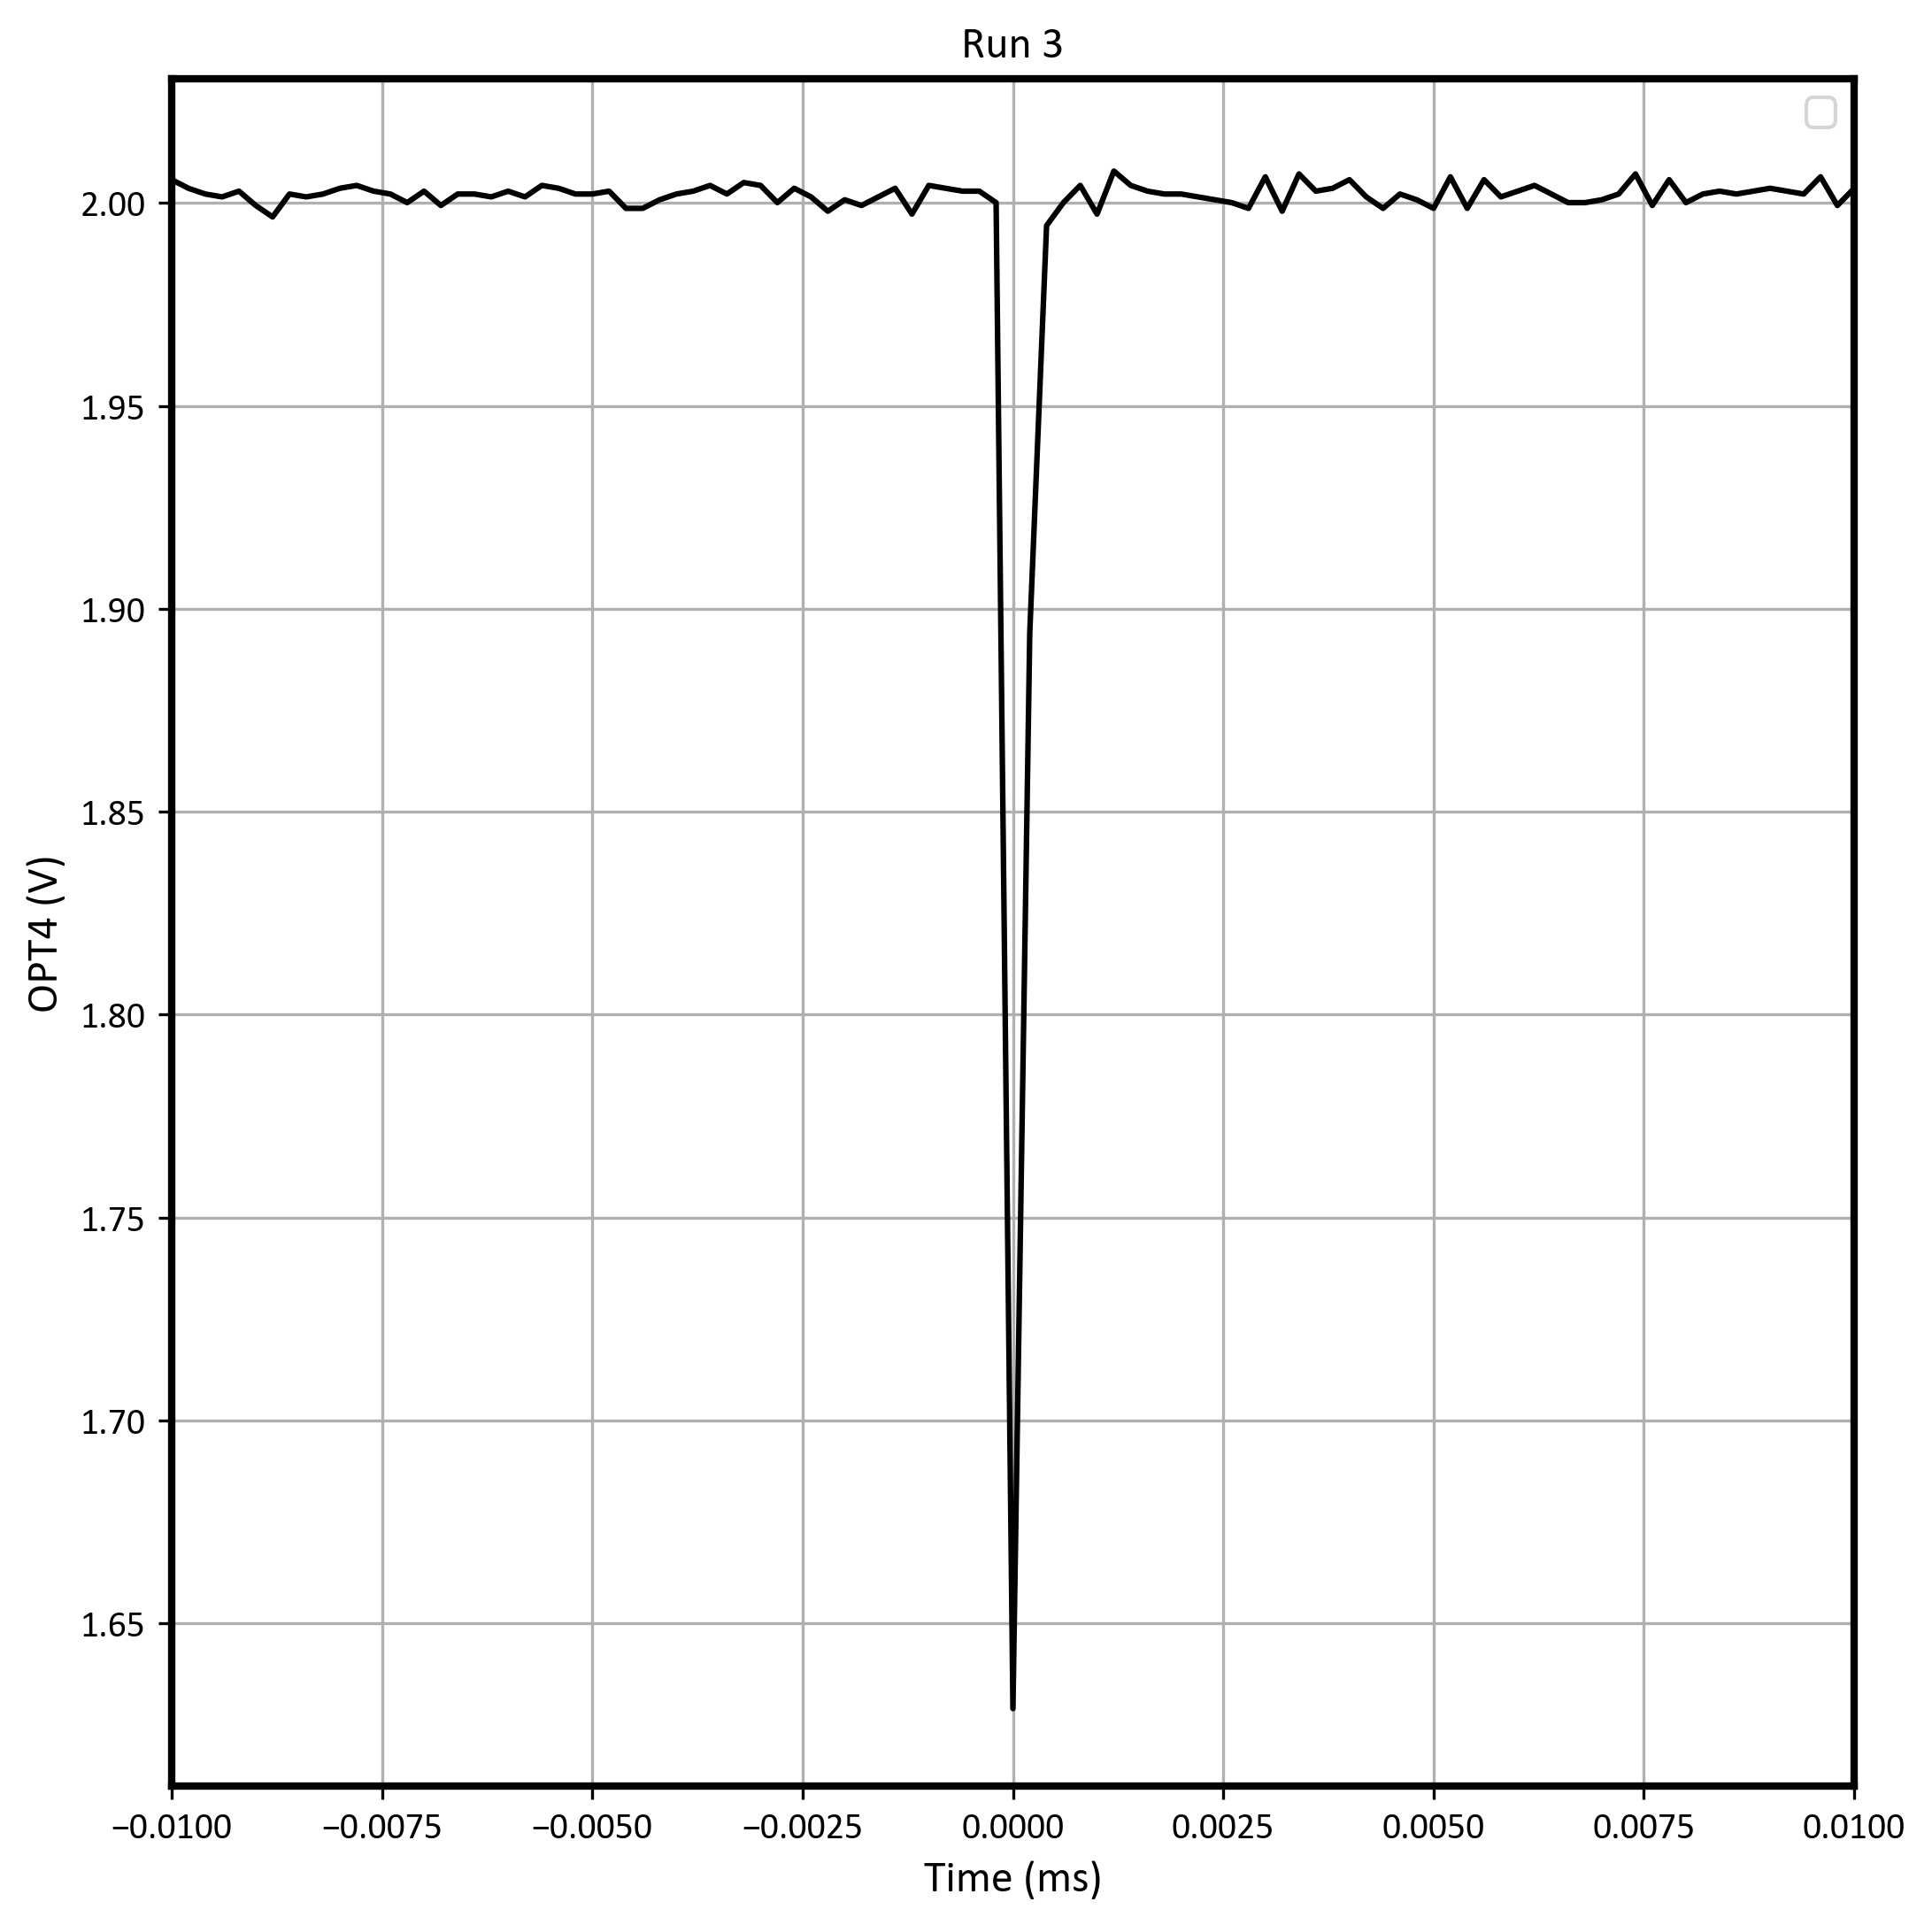 Figure 6-4 Worst-Case Negative
Transient on Run #3 With VS = ±6V, Gain = 1
Figure 6-4 Worst-Case Negative
Transient on Run #3 With VS = ±6V, Gain = 1When testing with VS = ±1.35V, Gain = 10, the worst-case positive transient occurred on channel 3 and reached a peak value of 1.2V. The event lasted 1.44µs. The worst-case negative transient occurred on channel 4 and reached a peak value of 0.72V. The event lasted 1.43µs.
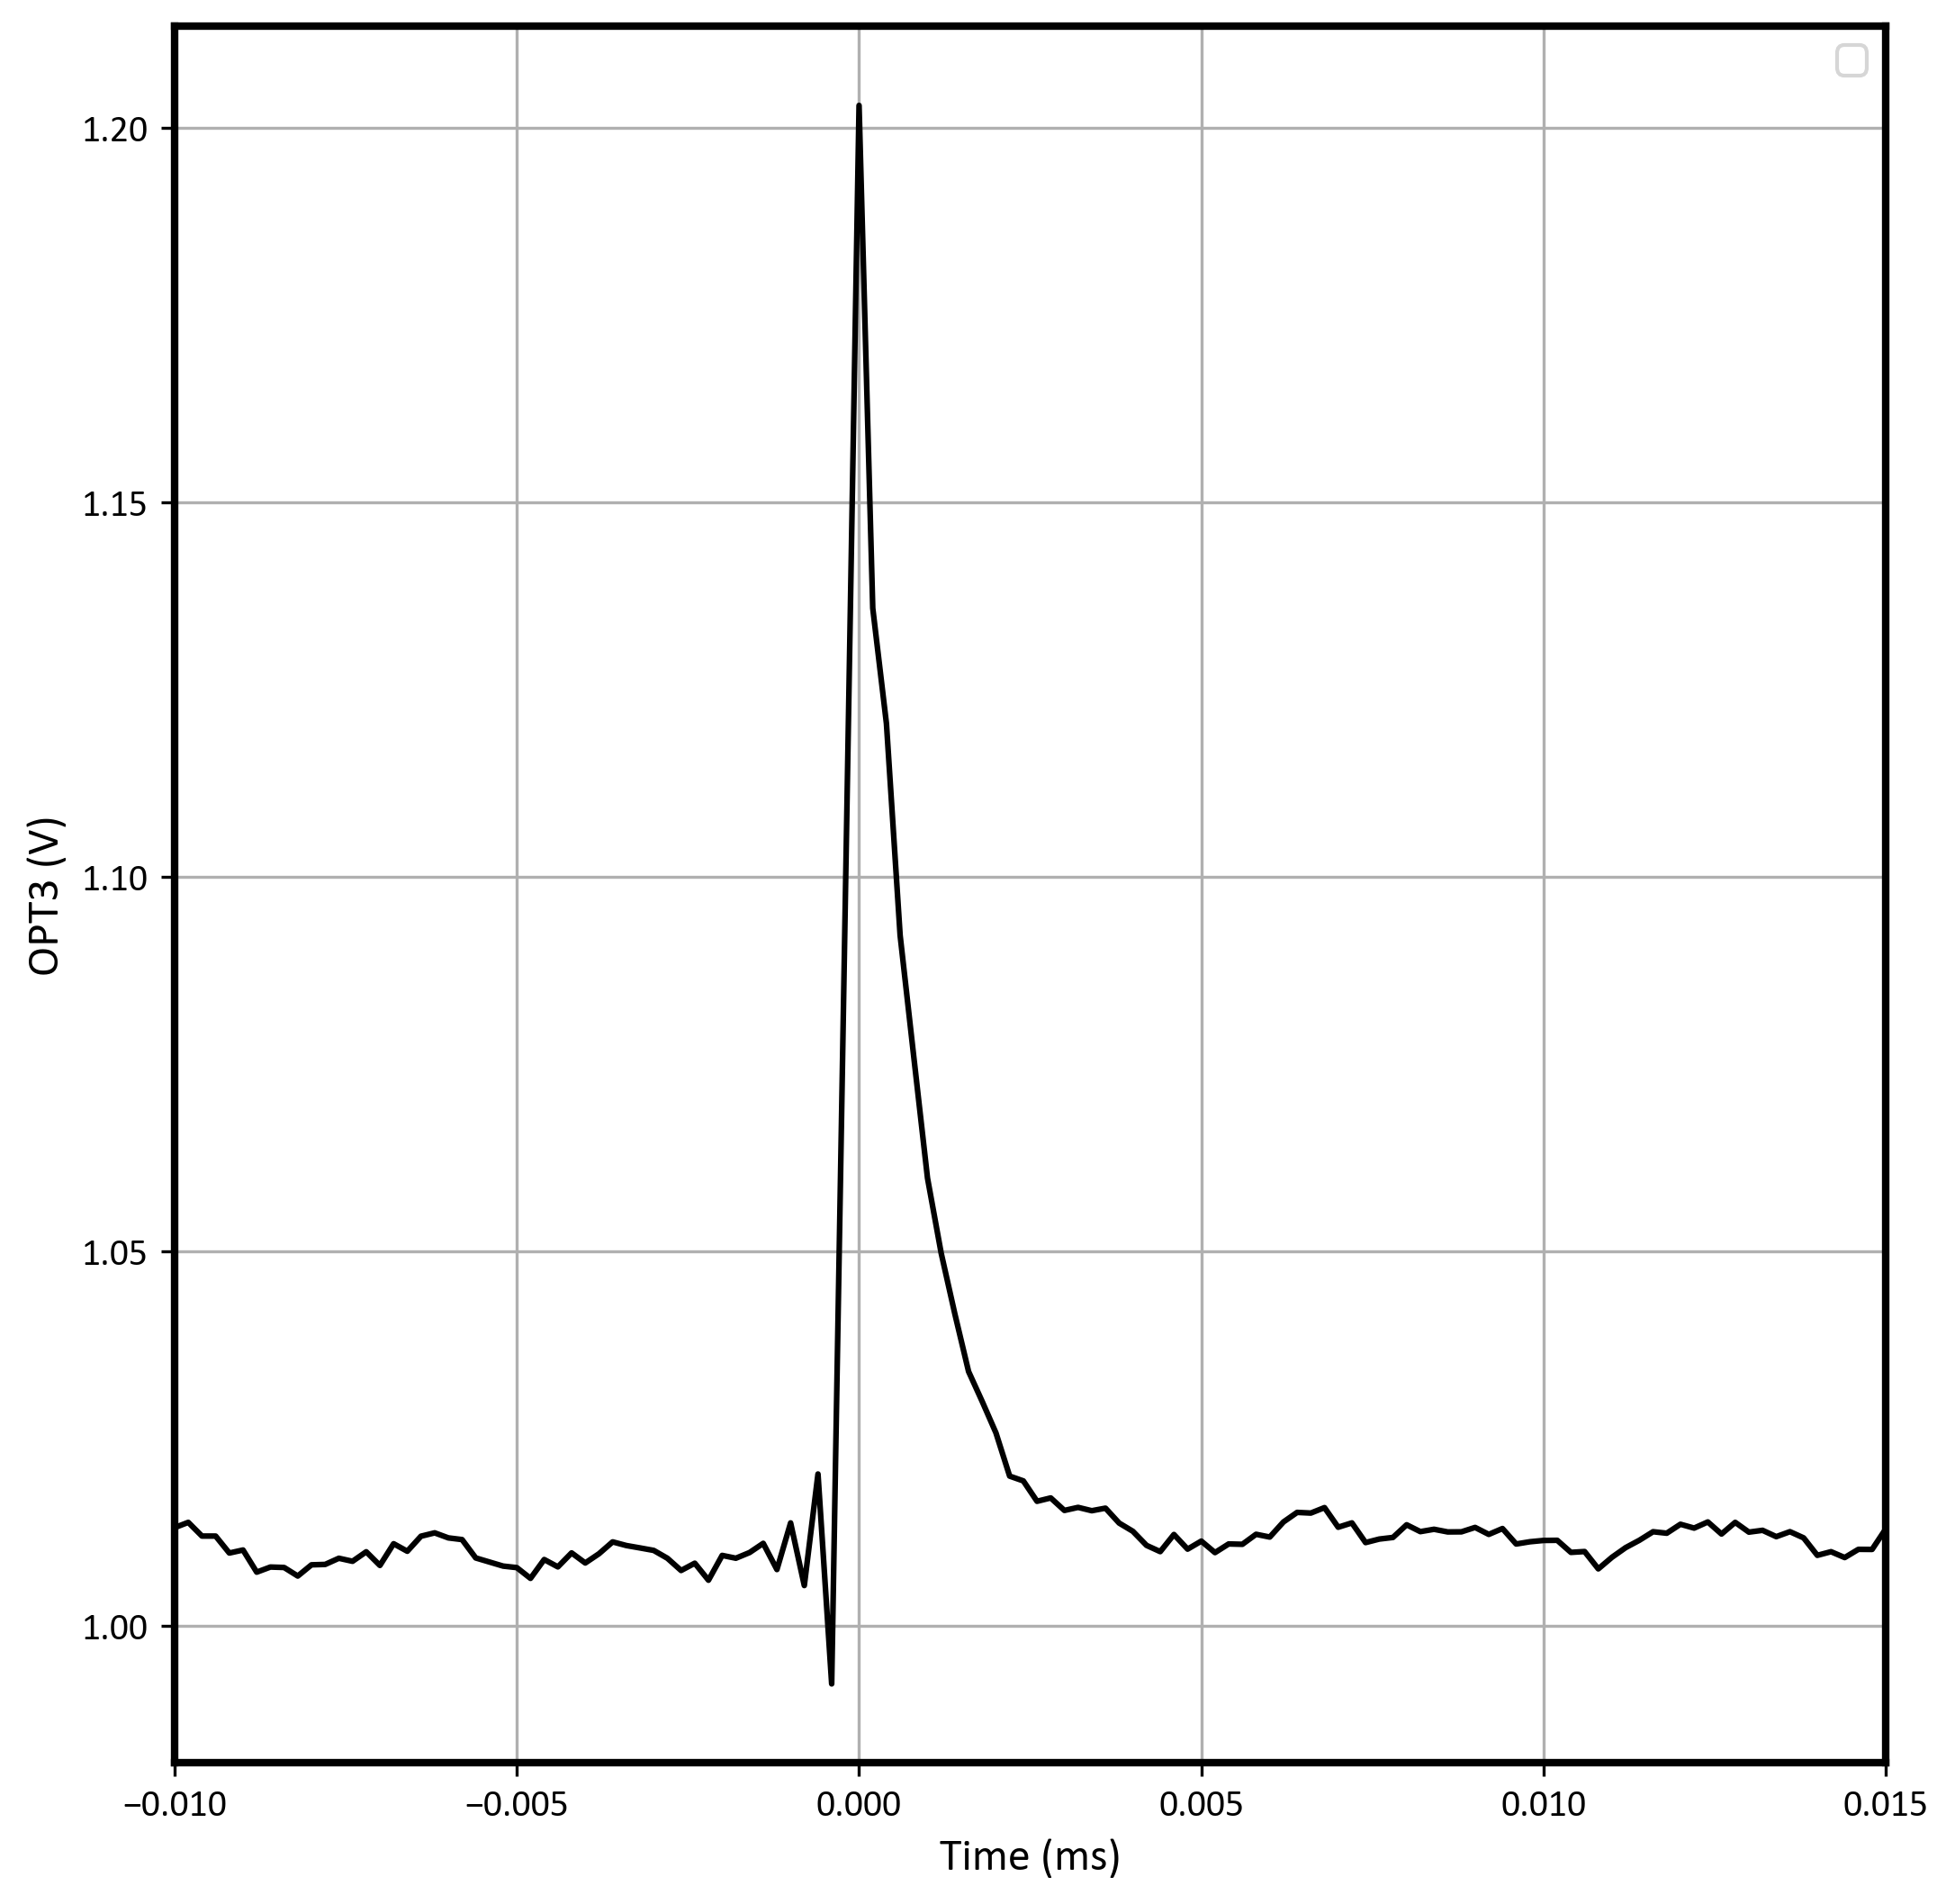 Figure 6-5 Worst-Case Positive
Transient on Run #5 With VS = ±1.35V, Gain = 10
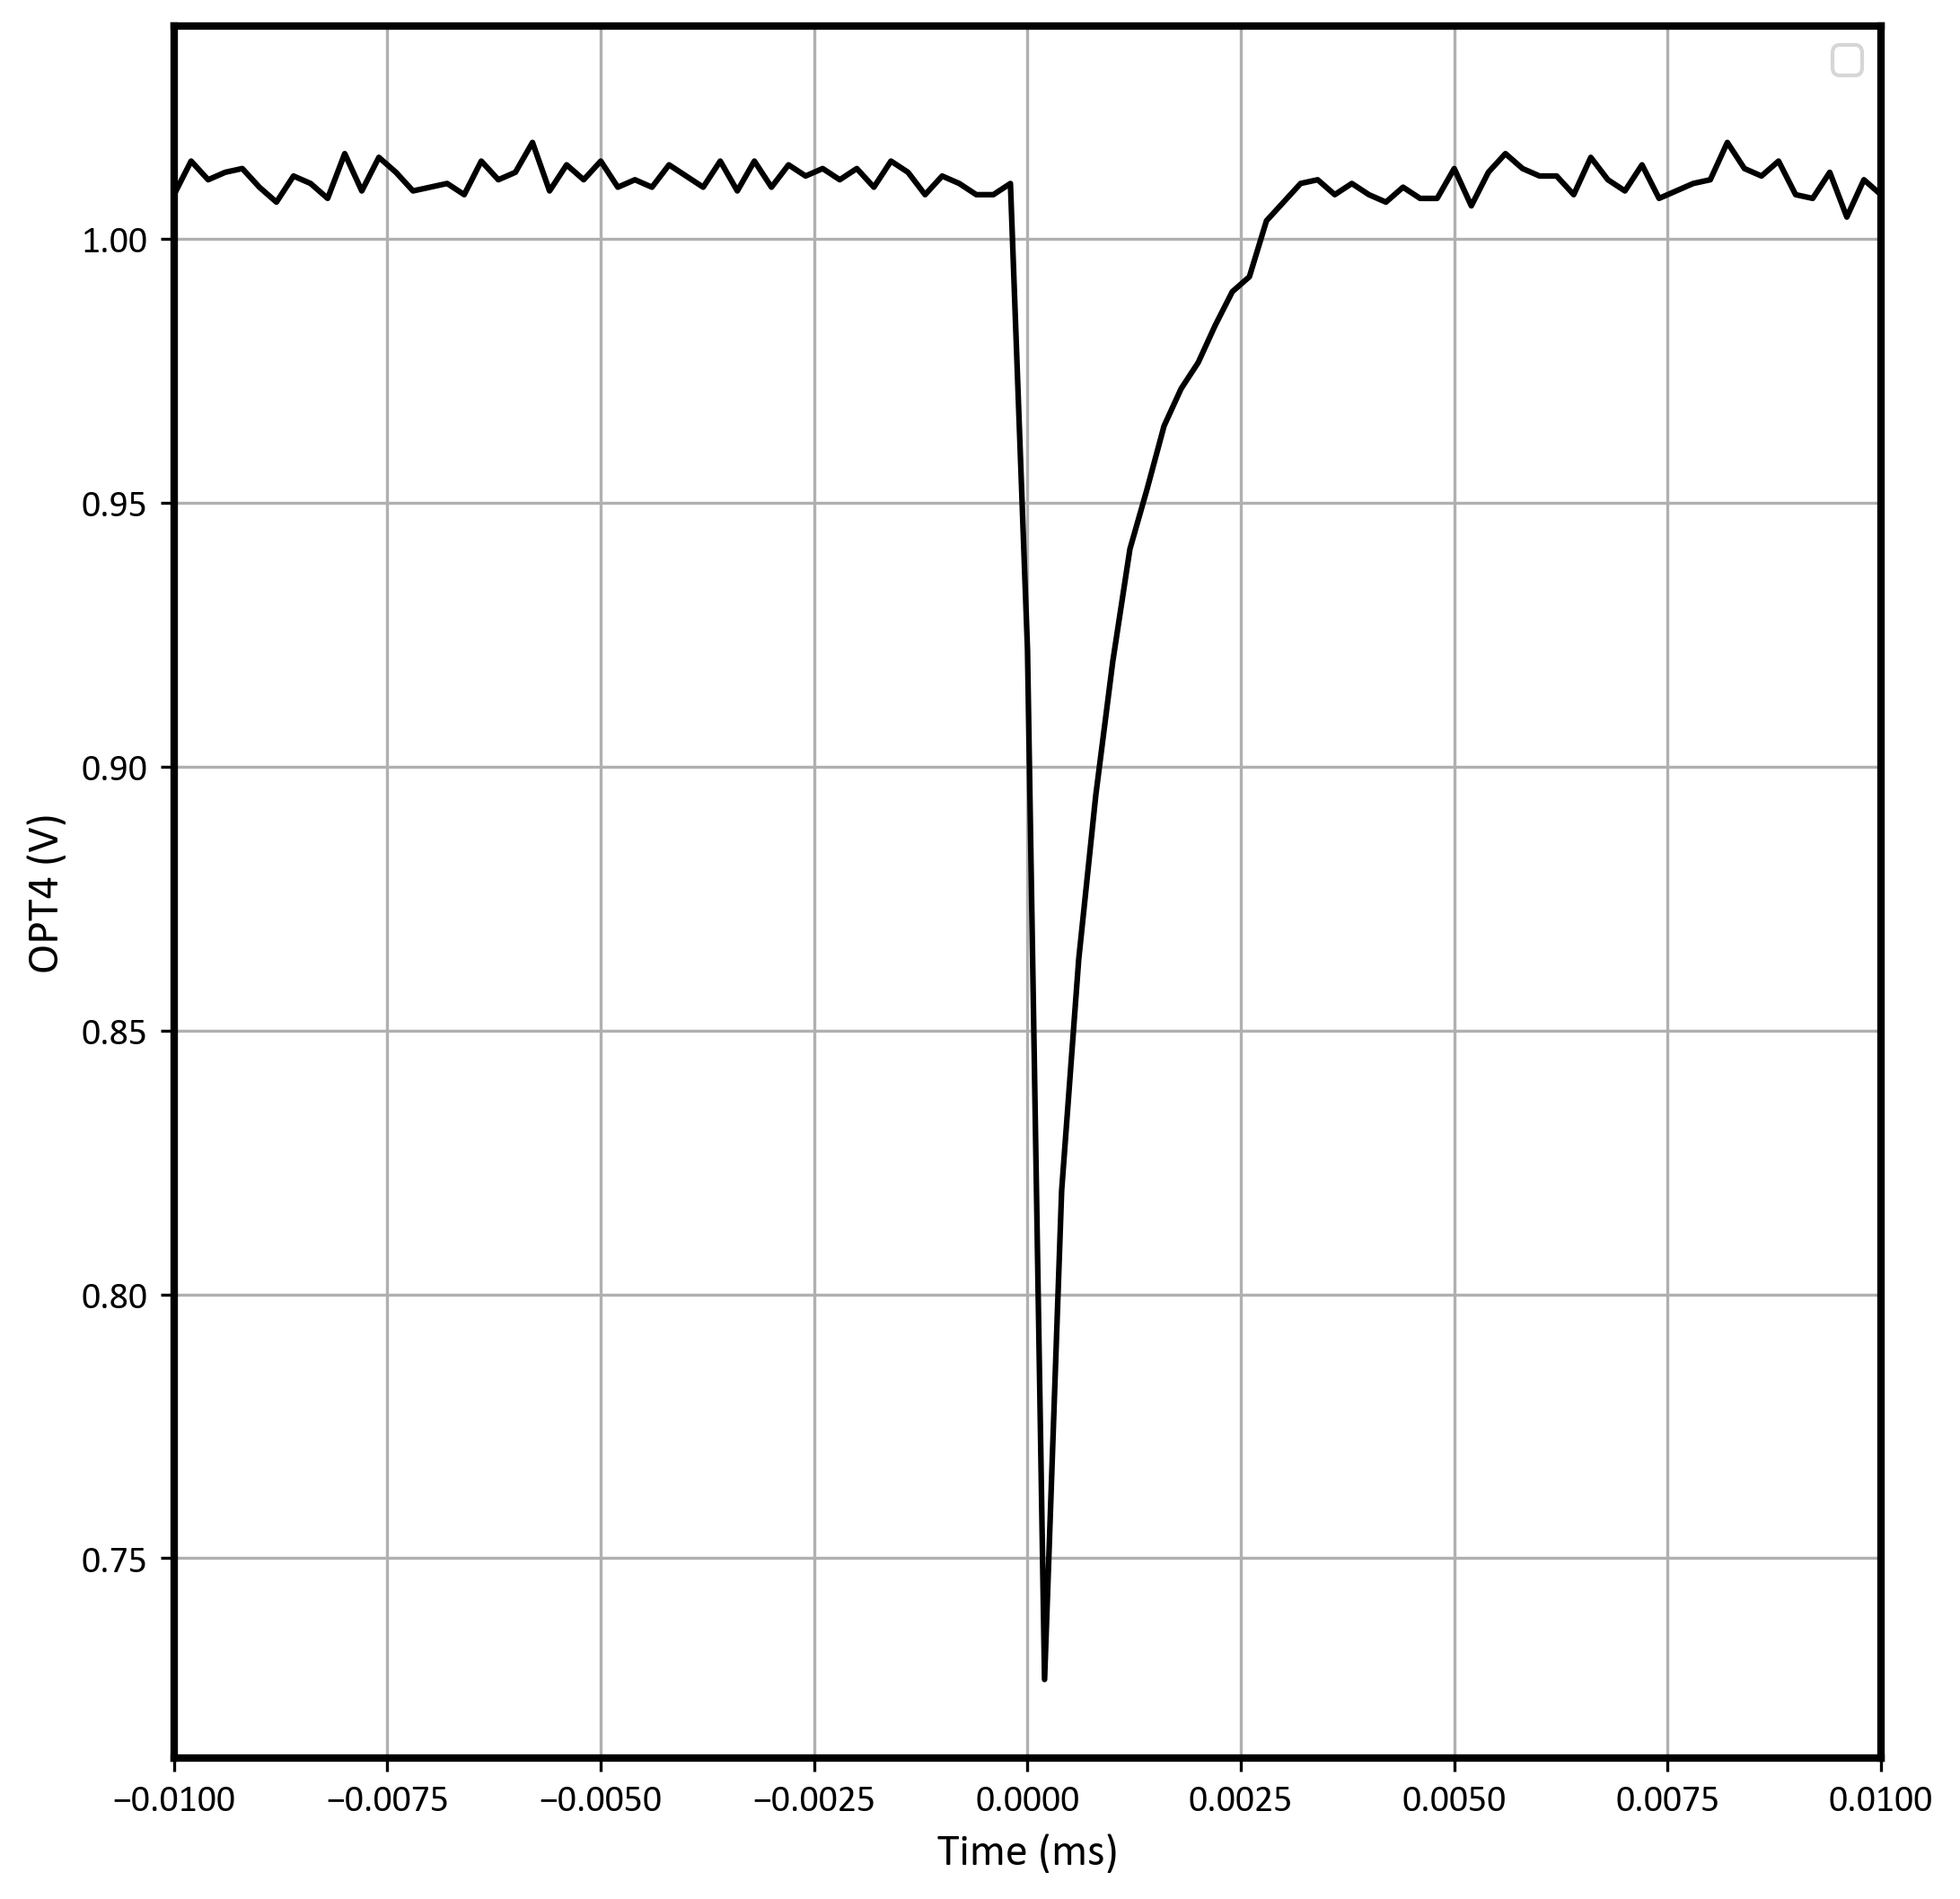 Figure 6-6 Worst-Case Negative
Transient on Run #5 With VS = ±1.35V, Gain = 10
Figure 6-6 Worst-Case Negative
Transient on Run #5 With VS = ±1.35V, Gain = 10When testing with VS = ±6V, Gain = 10, the worst-case positive transient occurred on channel 4 and reached a peak value of 2.56V. The event lasted 0.32µs. The worst-case negative transient occurred on channel 1 and reached a peak value of 1.7V. The event lasted 2µs.
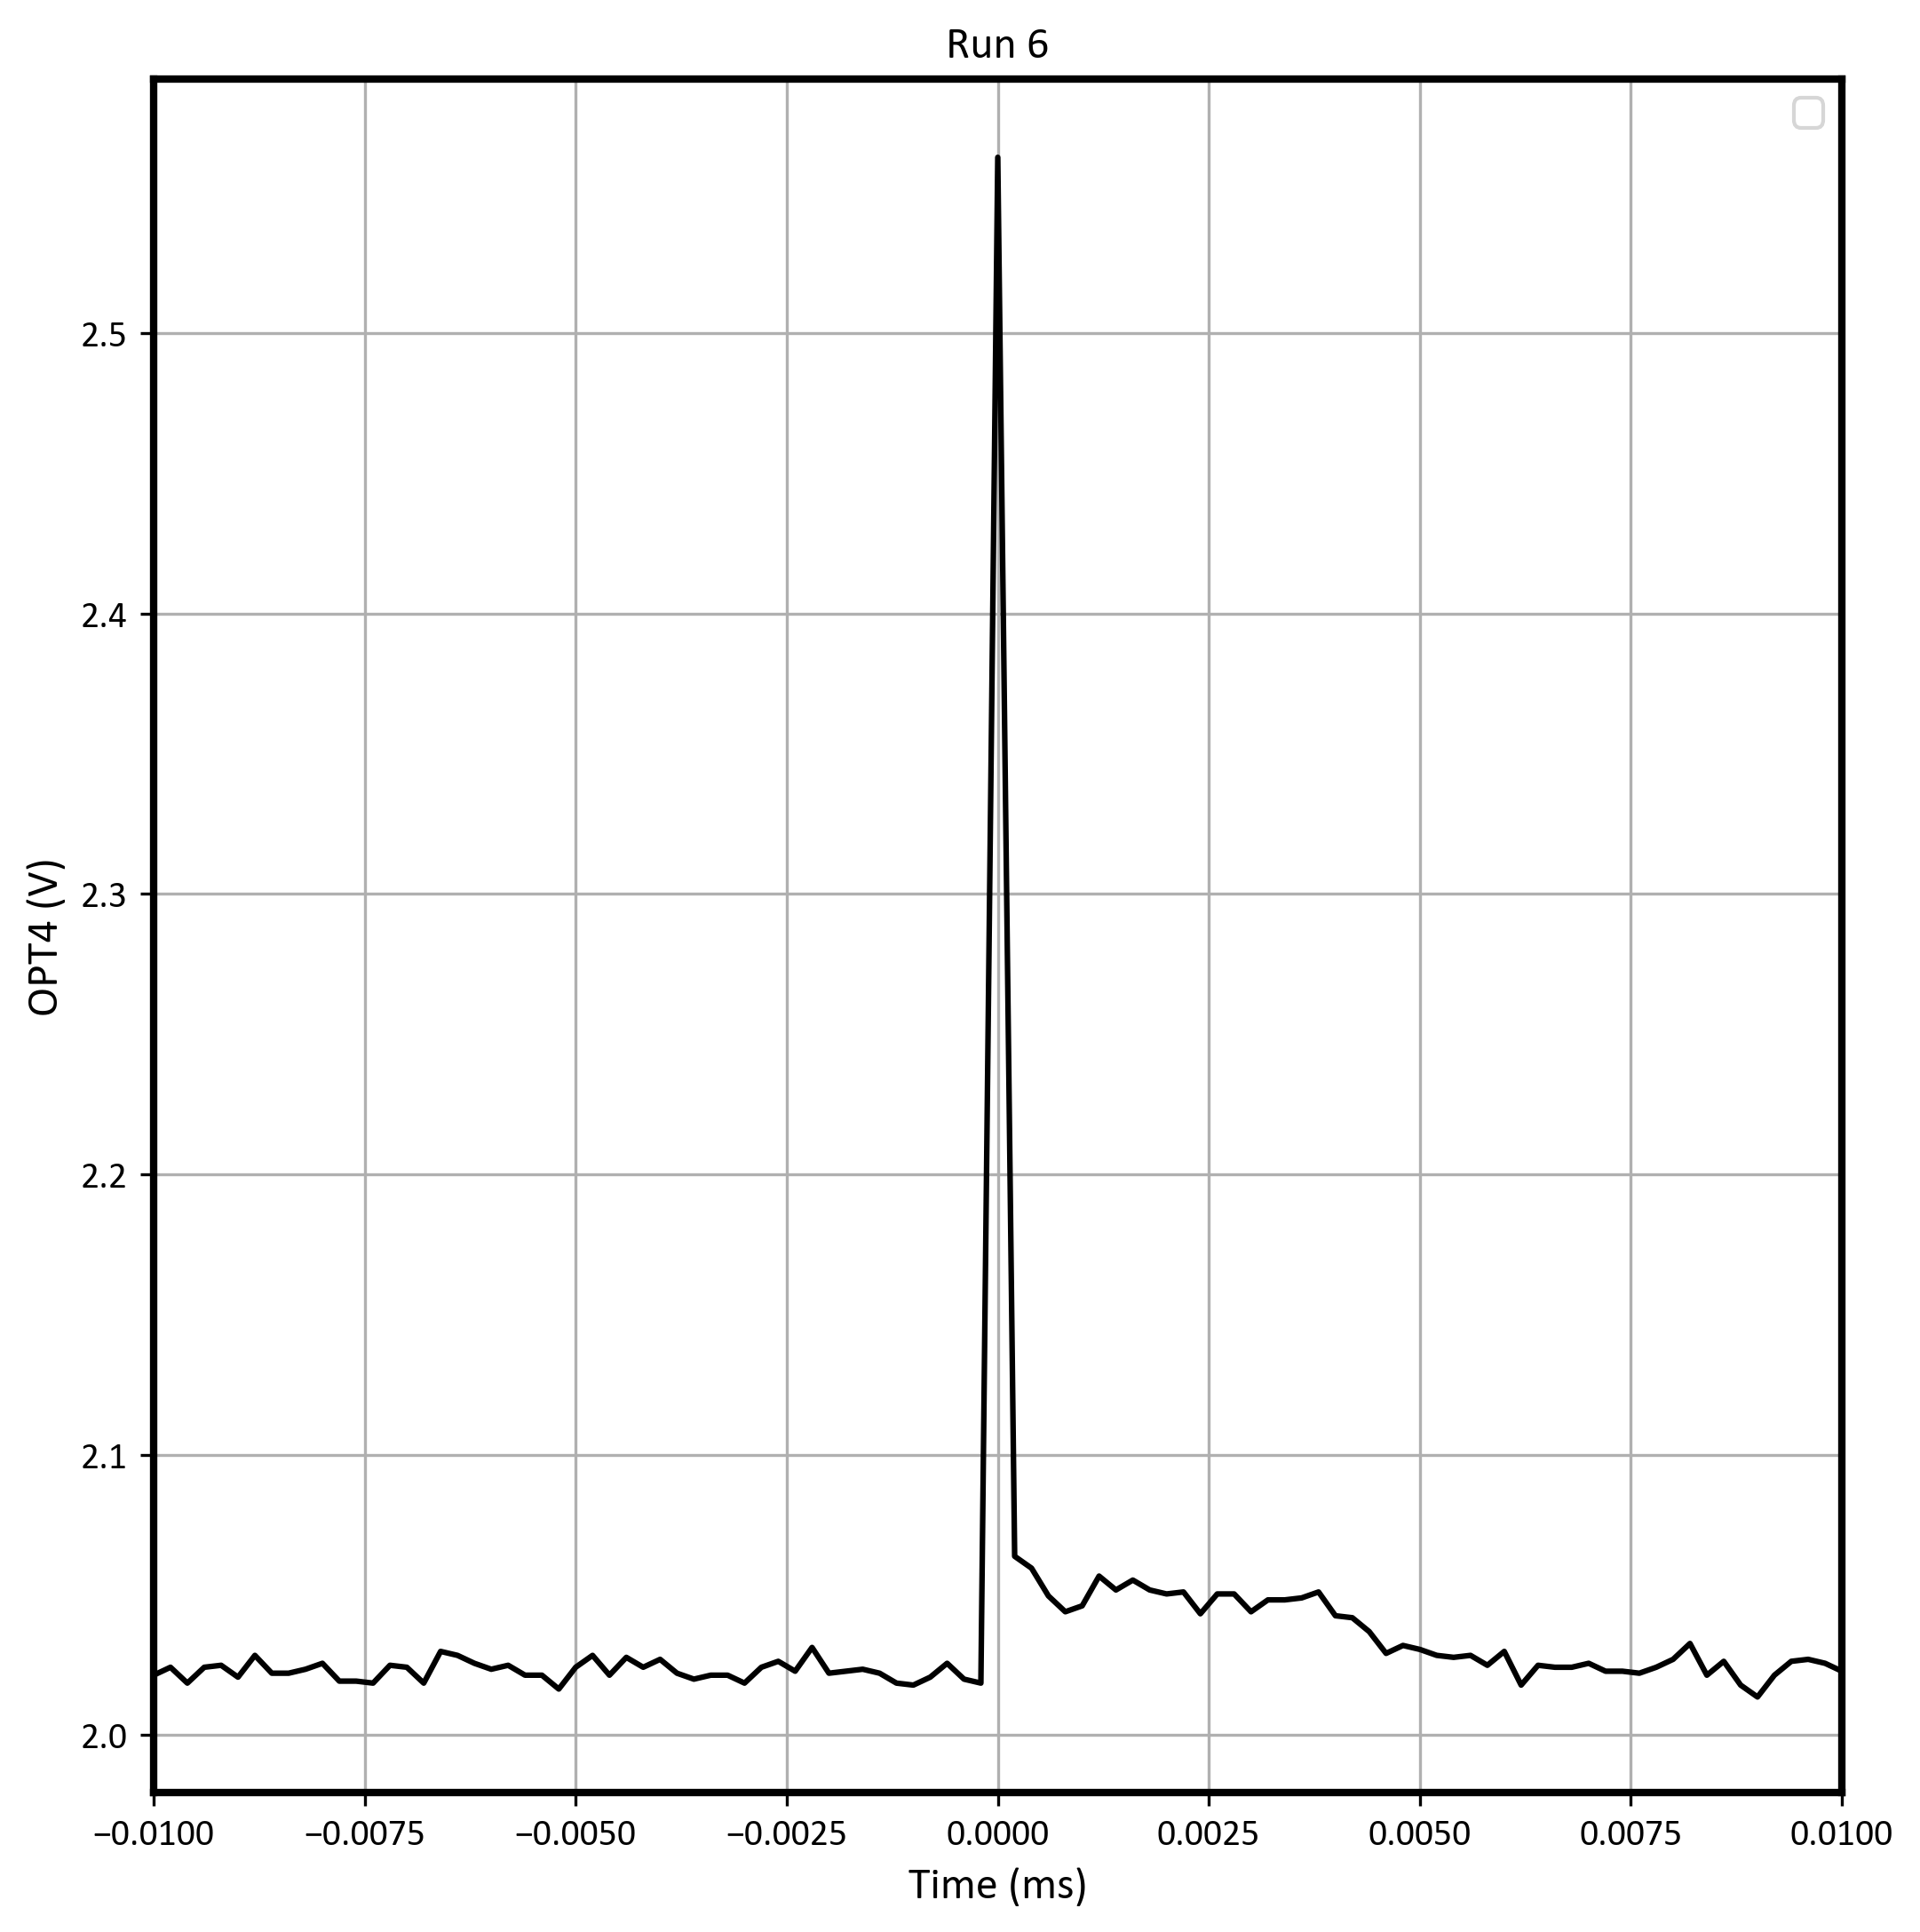 Figure 6-7 Worst-Case Positive
Transient on Run #6 With VS = ±6V, Gain = 10
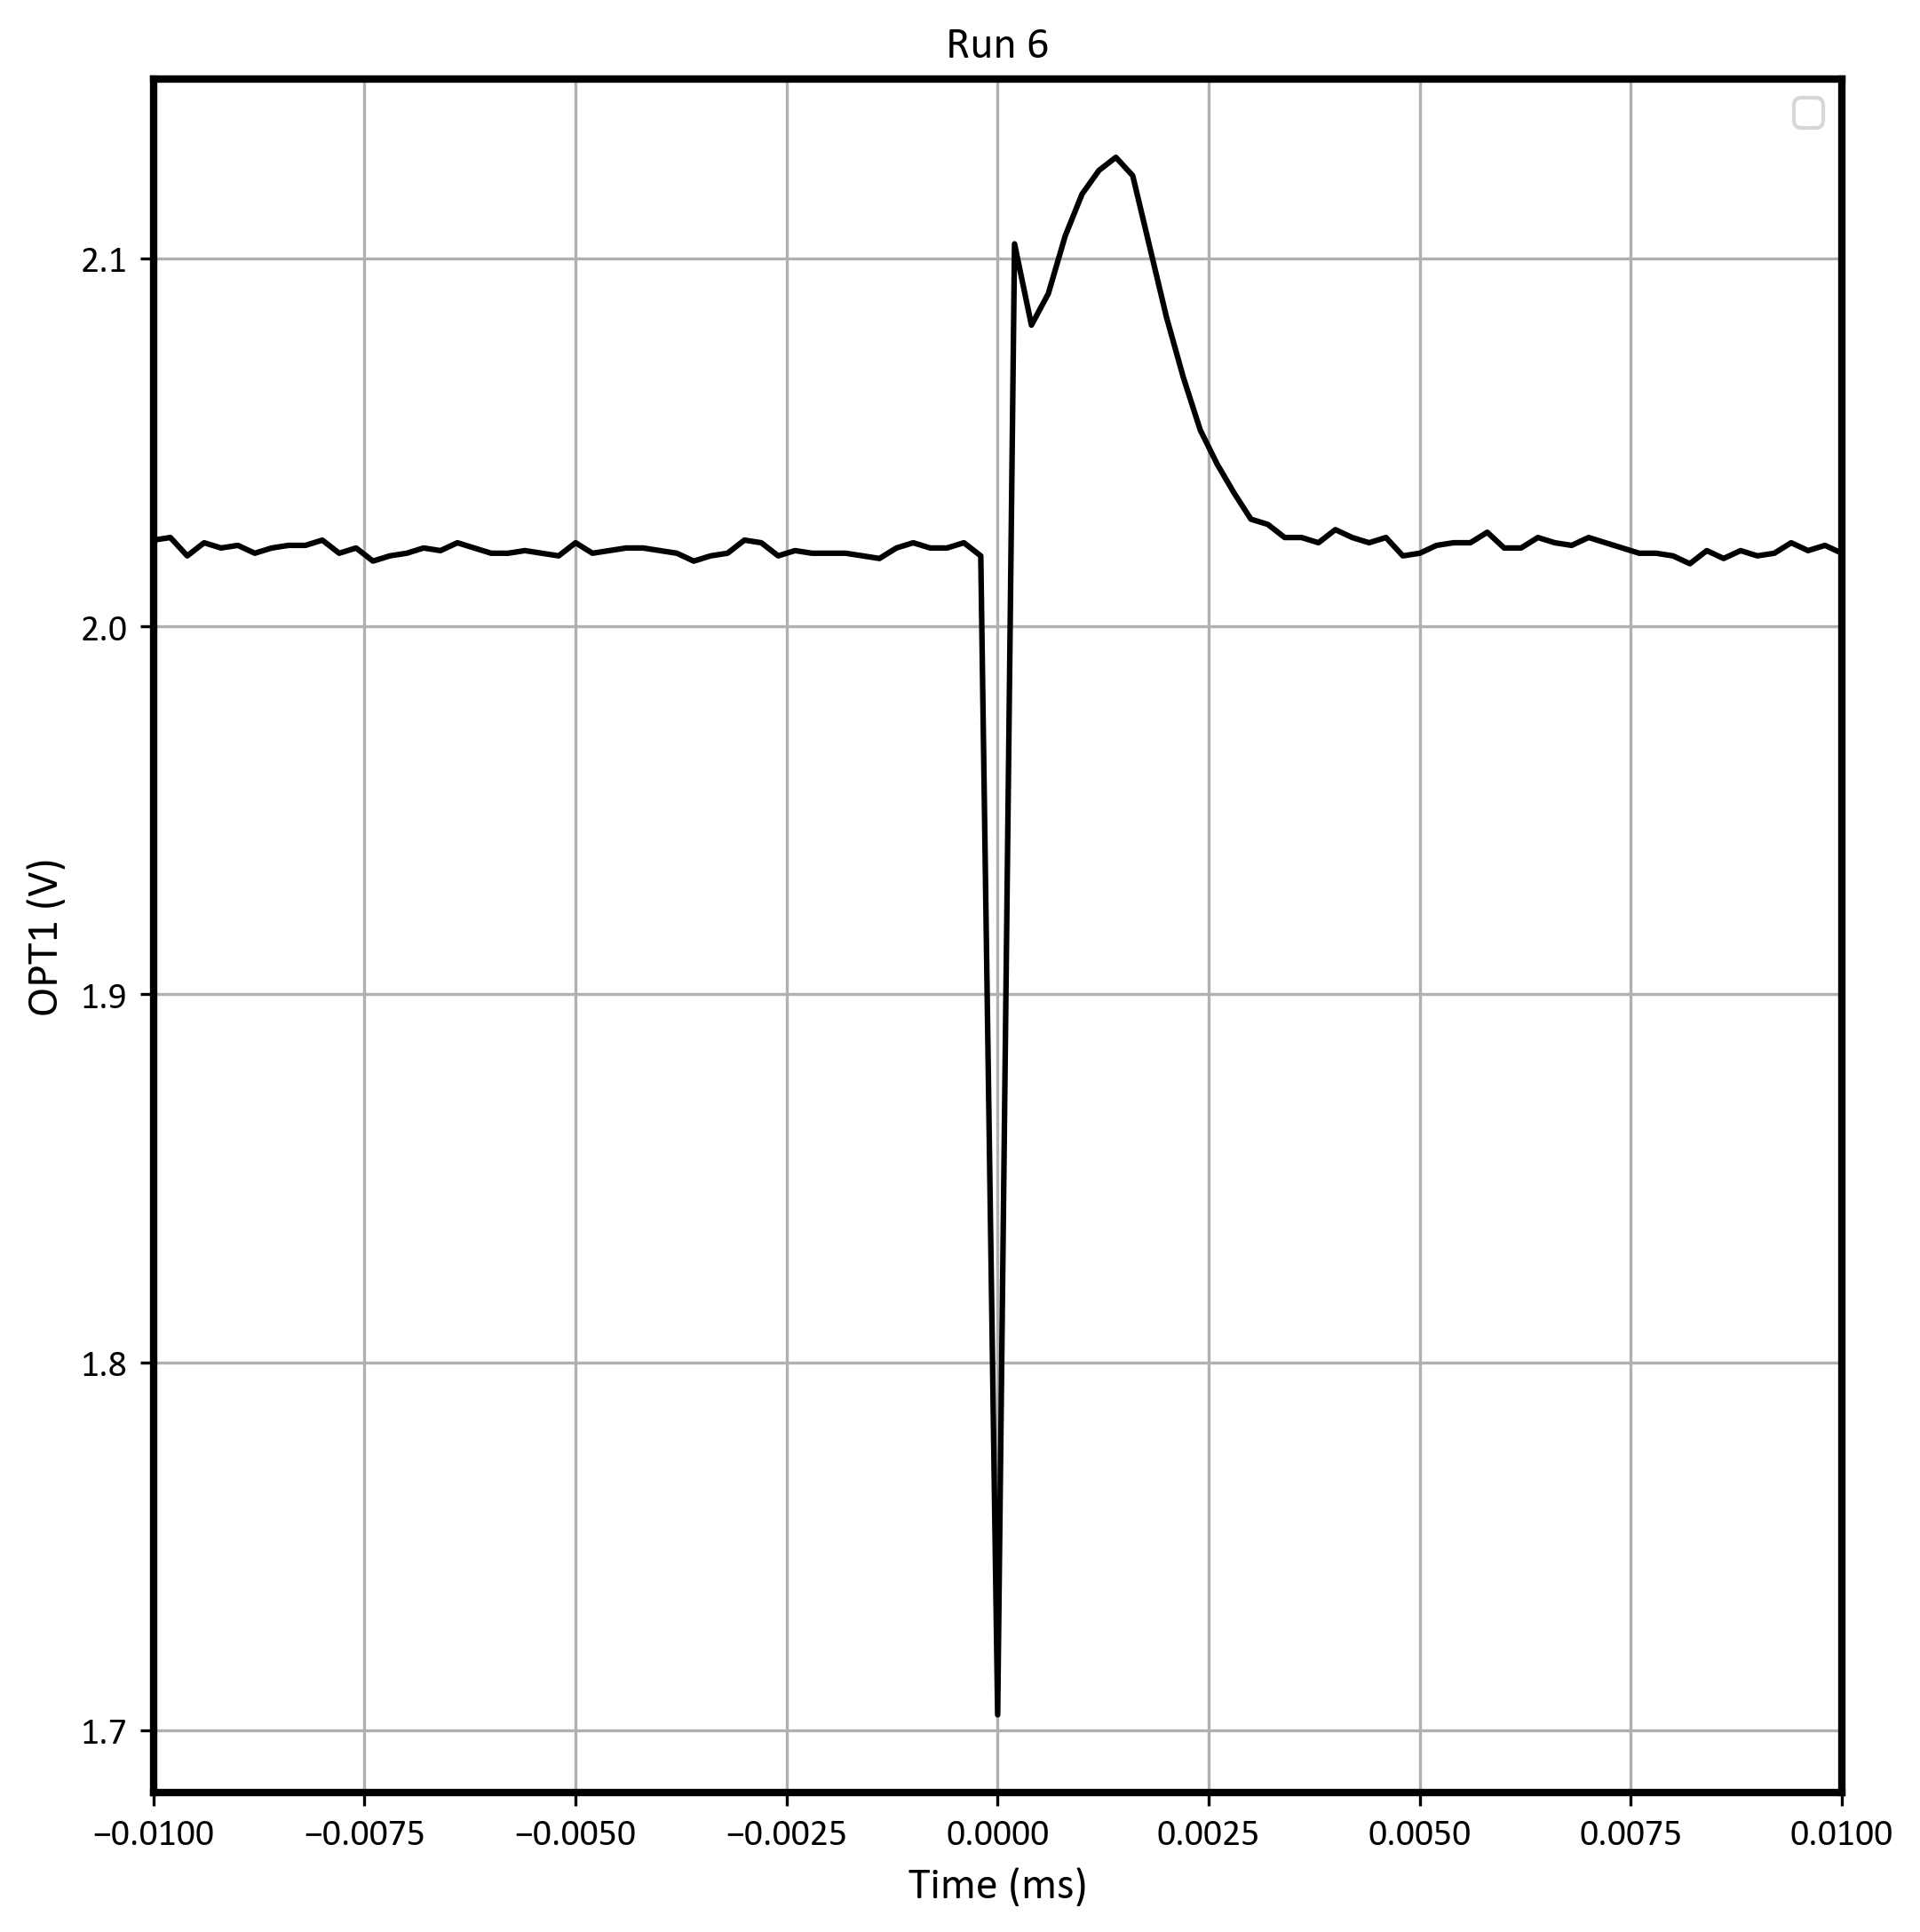 Figure 6-8 Worst-Case Negative
Transient on Run #6 With VS = ±6V, Gain = 10
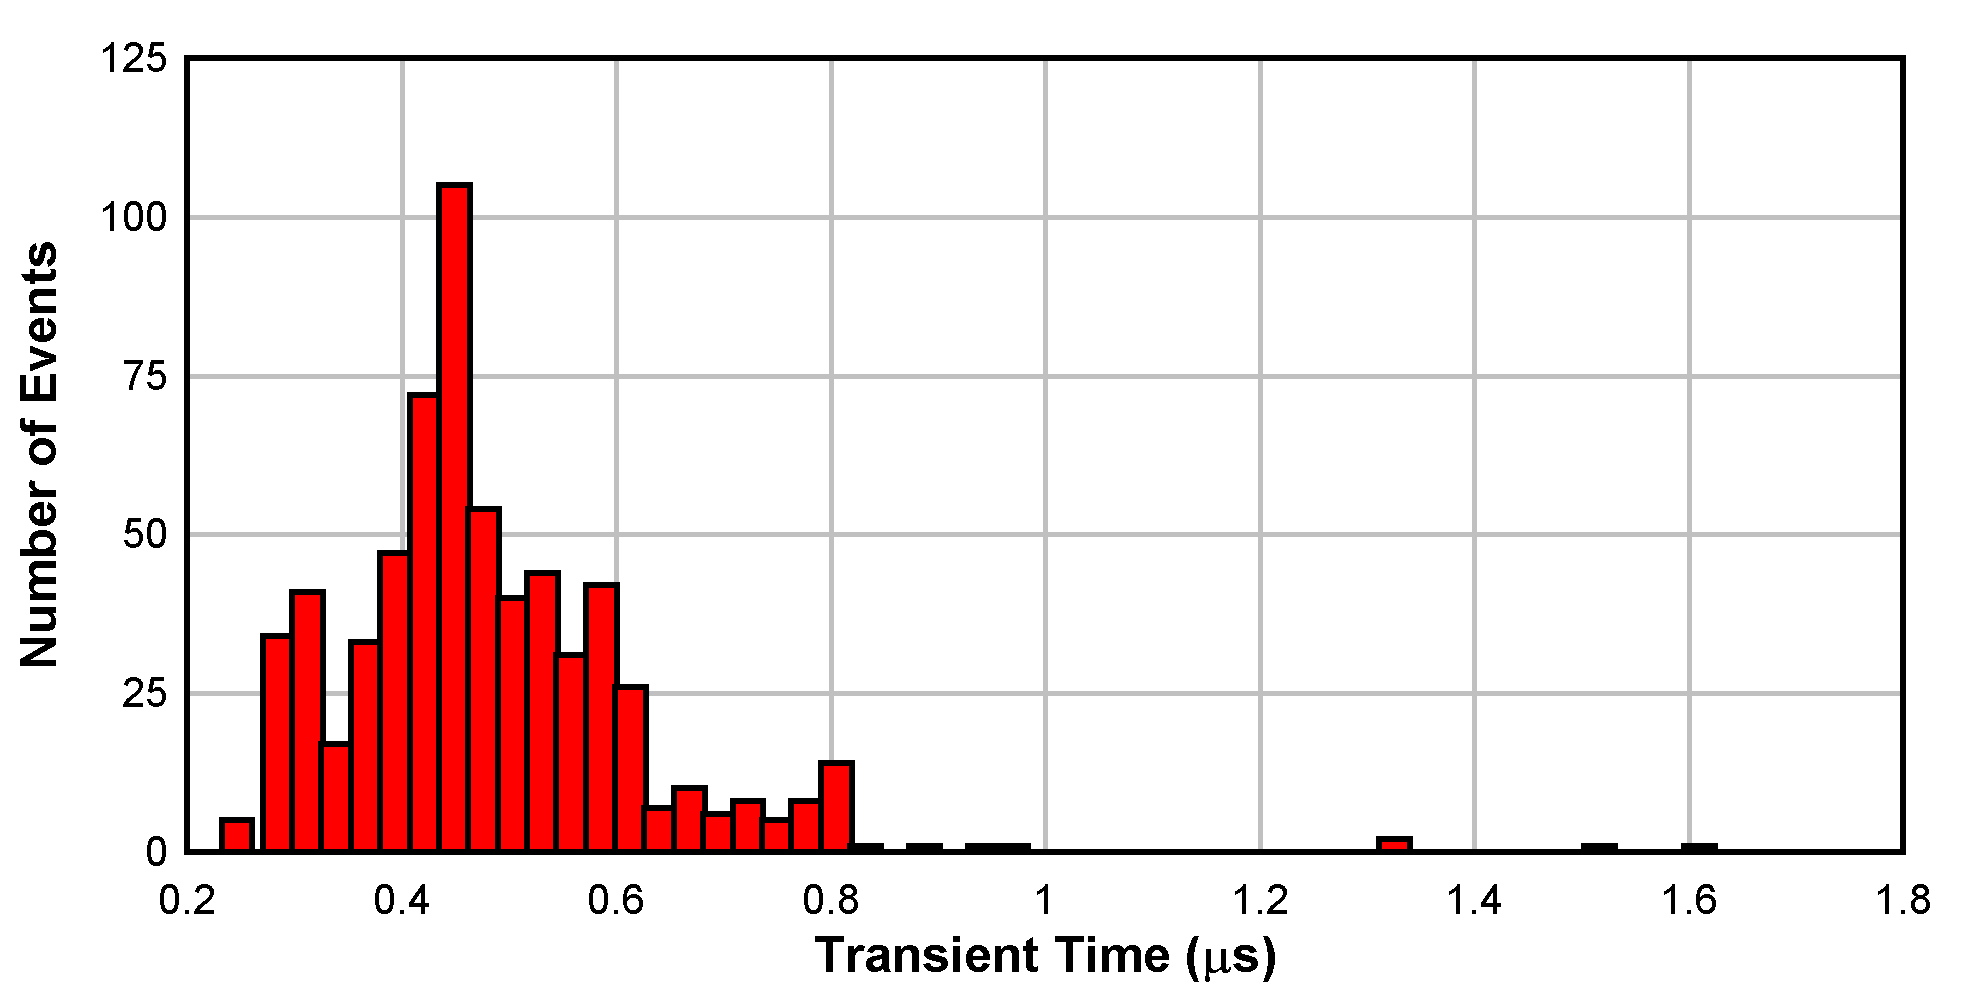 Figure 6-9 Histogram of the Transient
Recovery Time for Each Upset at Supply Voltages of ±1.35V and a Gain of
1
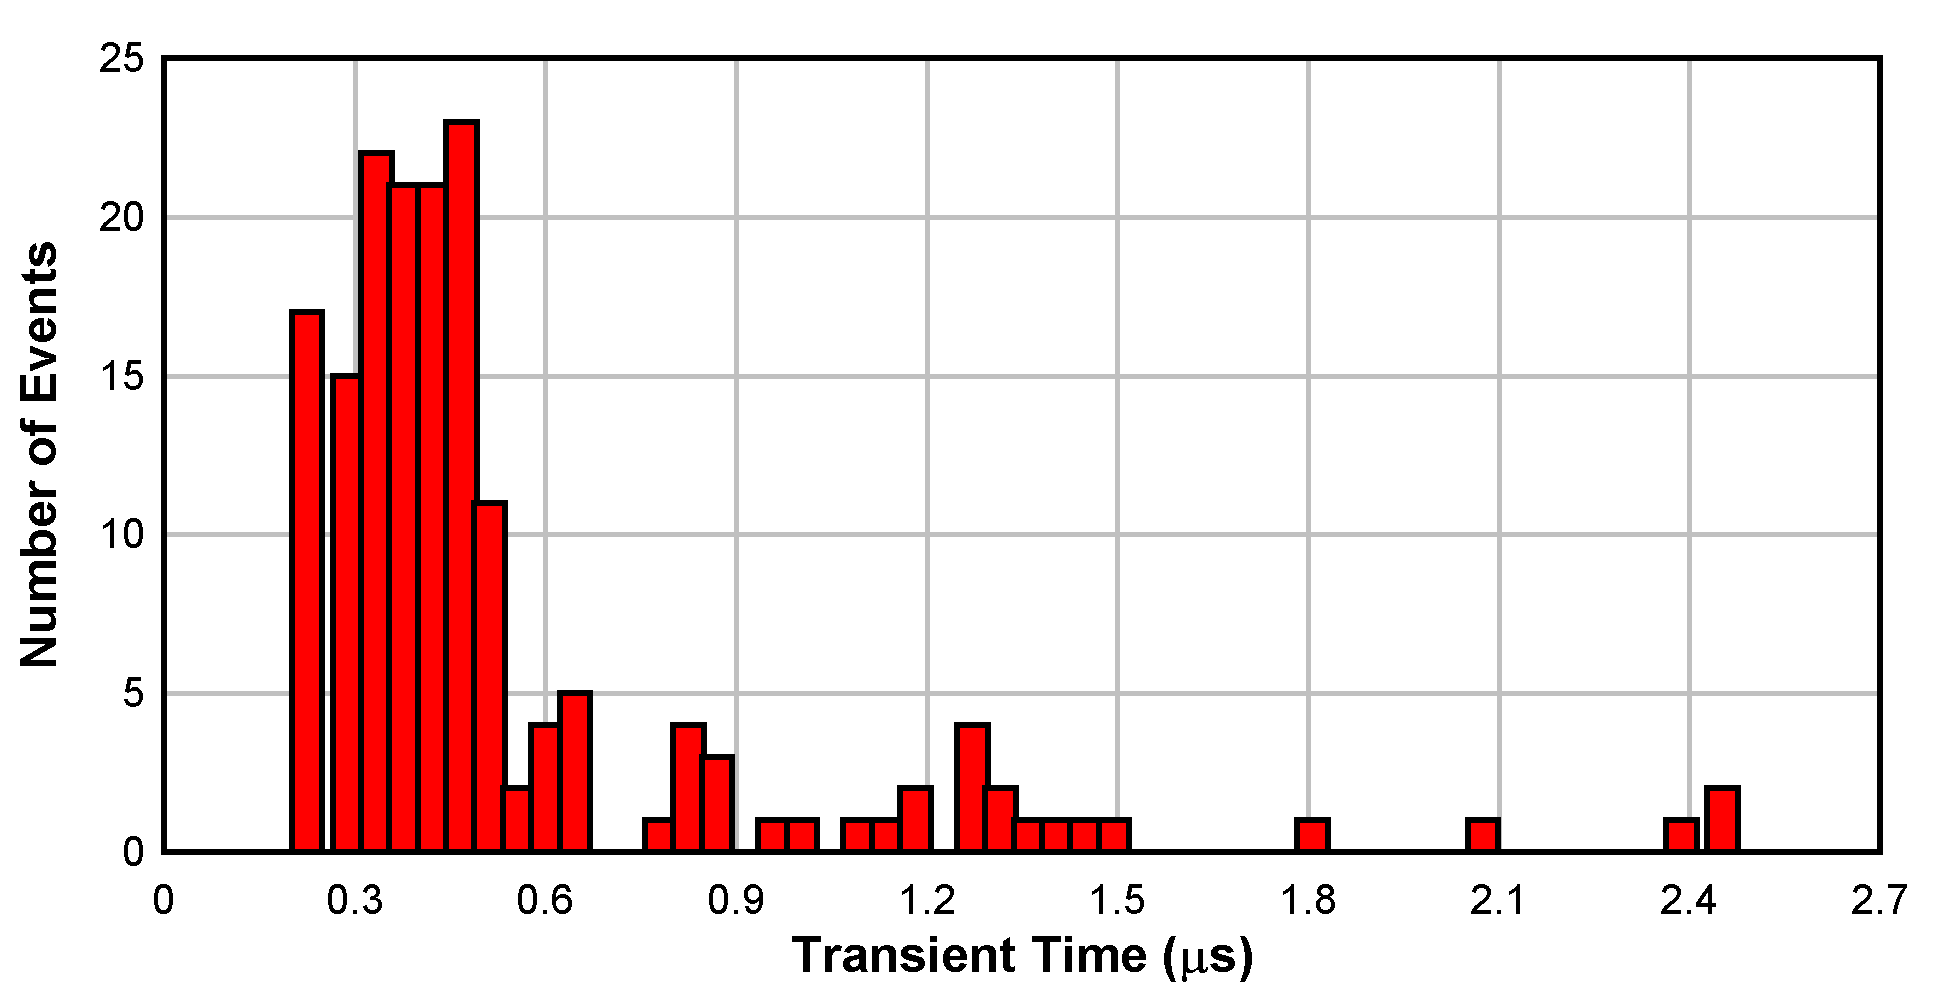 Figure 6-10 Histogram of the Transient
Recovery Time for Each Upset at Supply Voltages of ±6V and a Gain of 1
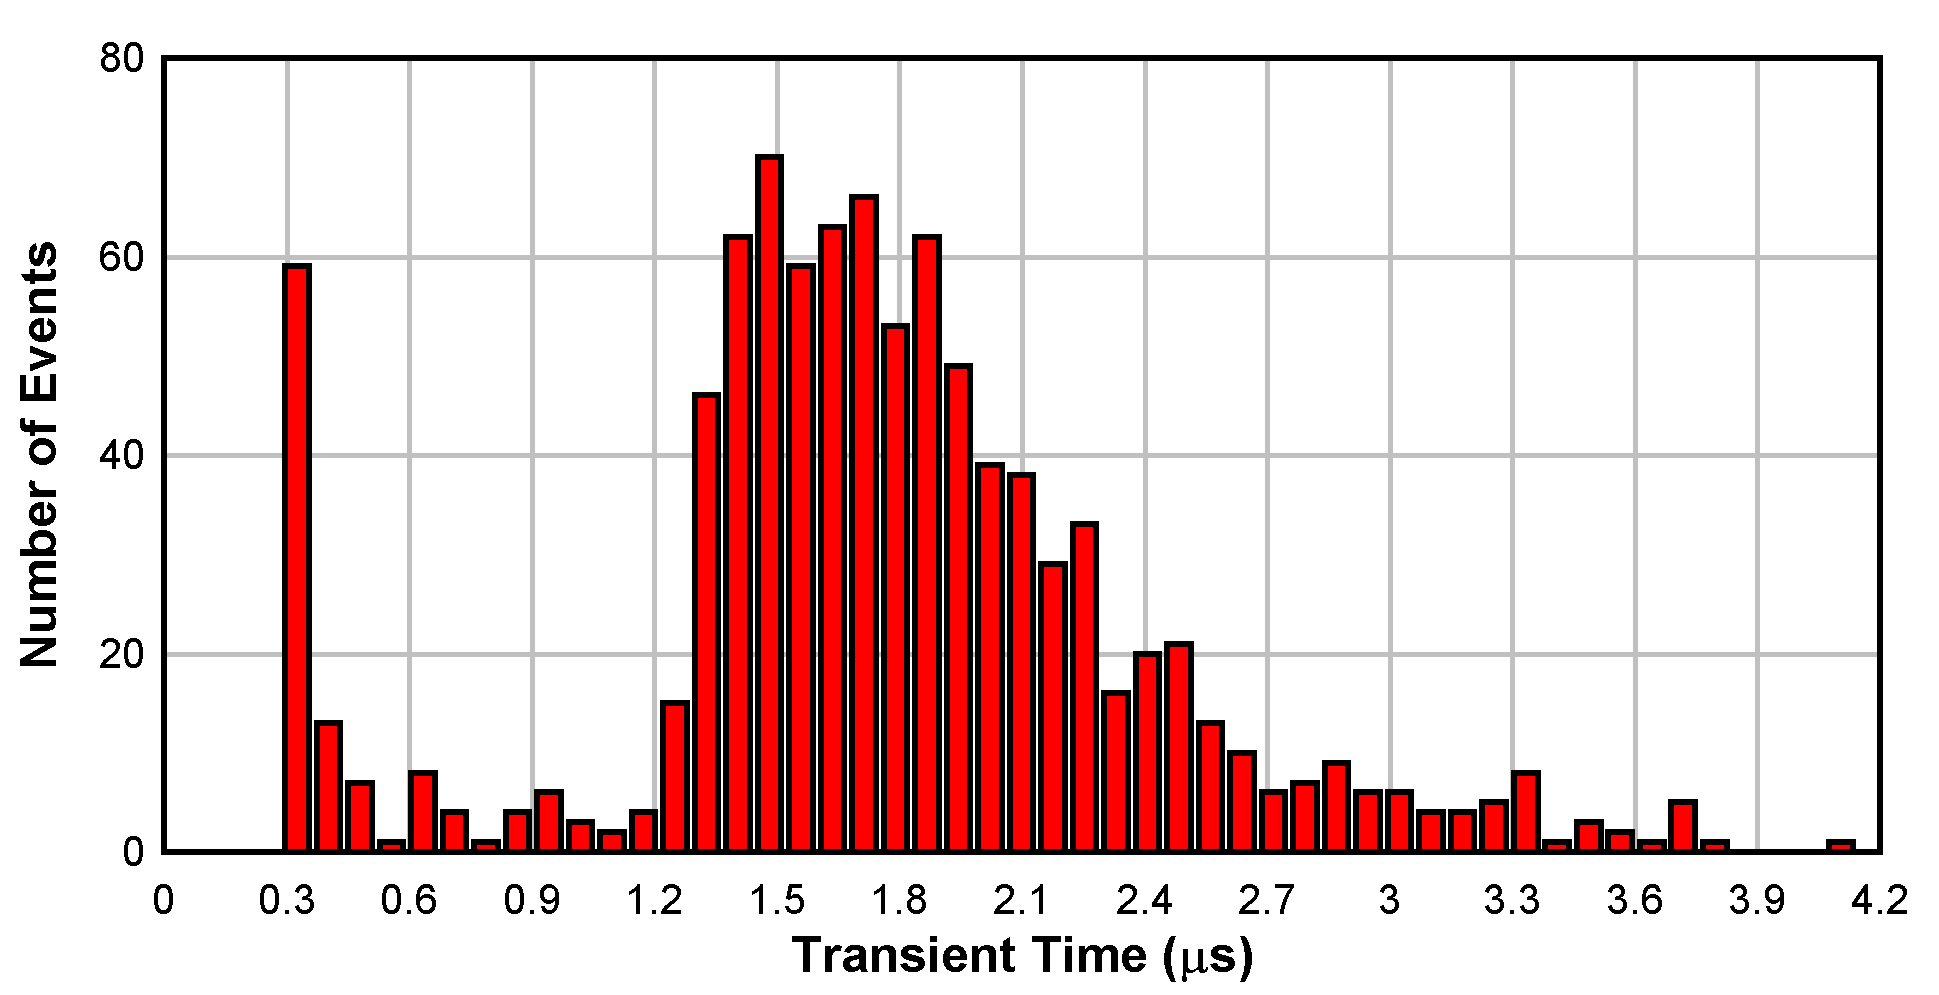 Figure 6-11 Histogram of the Transient
Recovery Time for Each Upset at Supply Voltages of ±1.35V and a Gain of
10
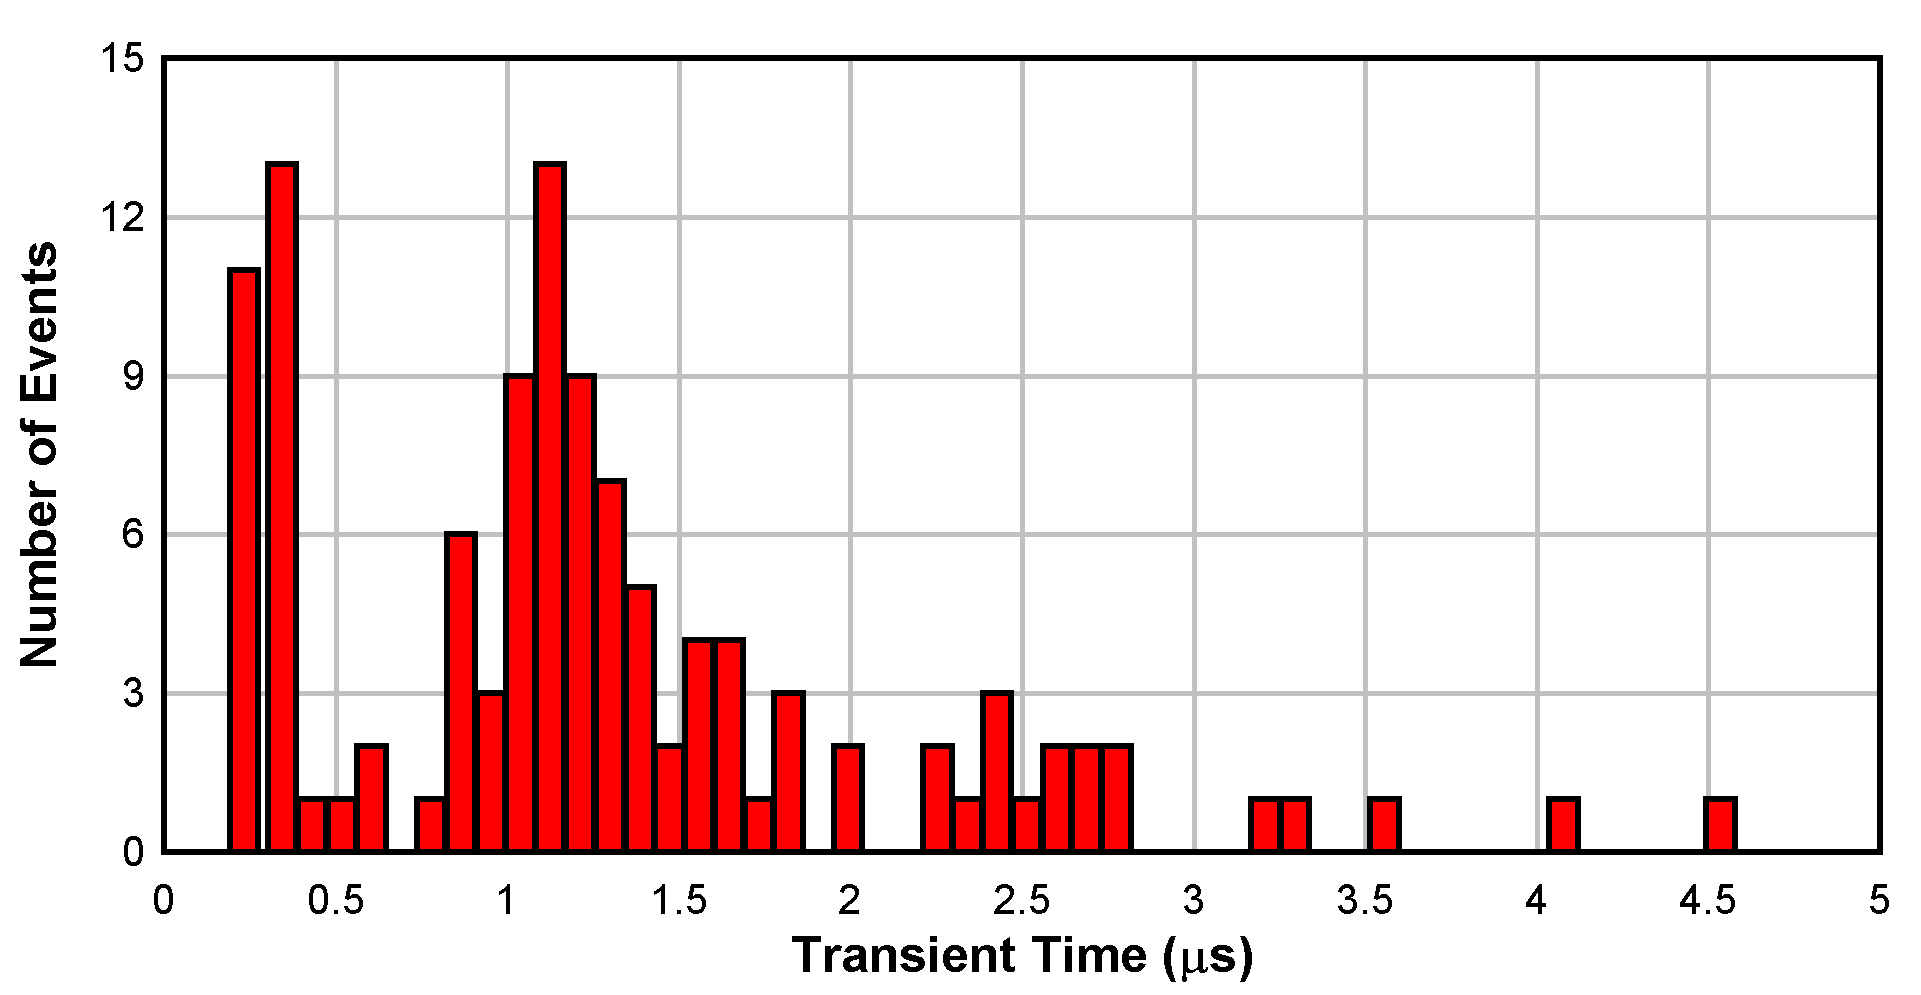 Figure 6-12 Histogram of the Transient
Recovery Time for Each Upset at Supply Voltages of ±6V and a Gain of 10
Figure 6-12 Histogram of the Transient
Recovery Time for Each Upset at Supply Voltages of ±6V and a Gain of 10Figure 6-13 through Figure 6-28 show the plots of the SET cross section versus LET for the different operating modes used during SET testing for each channel. At low LETs, a very low number of transient events (≤ 2) occurred, resulting in different onsets from channel to channel. This causes the cross section plots to look different for each channel.
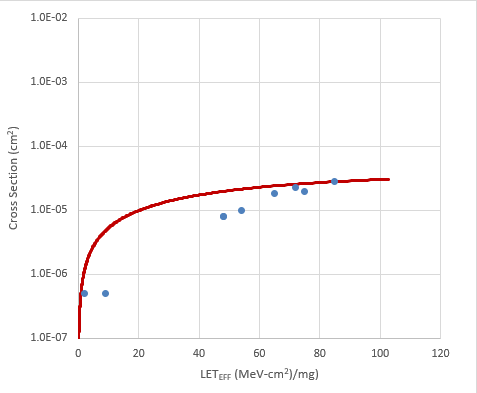 Figure 6-13 Weibull Plot:
VS ±1.35V and Gain = 1 - Channel 1
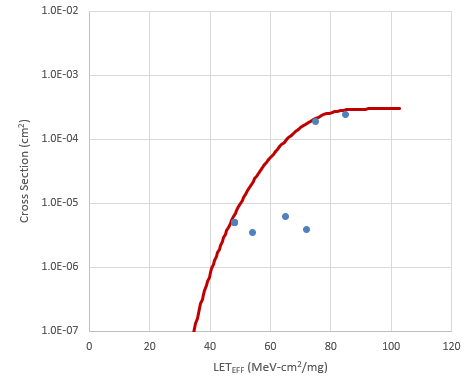 Figure 6-15 Weibull Plot:
VS ±1.35V and Gain = 1 - Channel 3
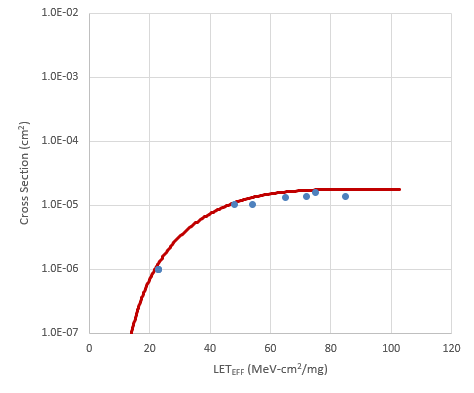 Figure 6-17 Weibull Plot:
VS ±6V and Gain = 1 - Channel 1
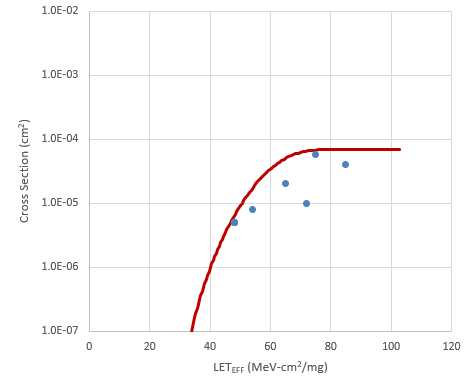 Figure 6-19 Weibull Plot:
VS ±6V and Gain = 1 - Channel 3
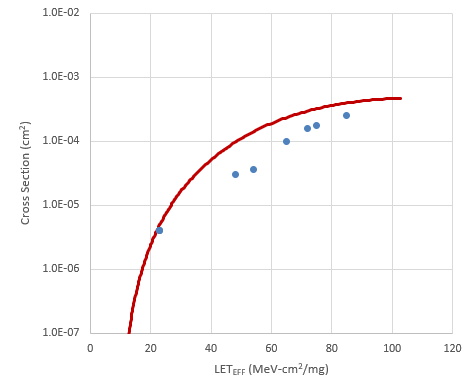 Figure 6-21 Weibull Plot:
VS ±1.35V and Gain = 10 - Channel 1
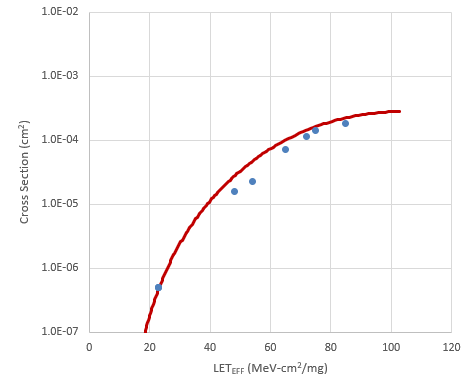 Figure 6-23 Weibull Plot:
VS ±1.35V and Gain = 10 - Channel 3
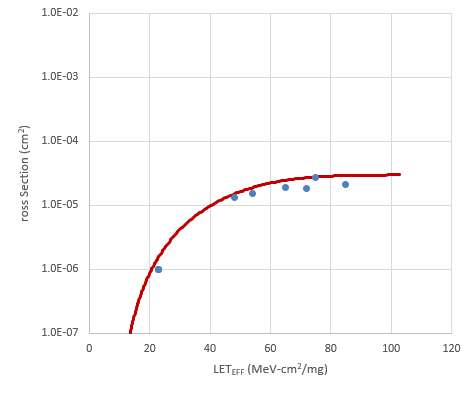 Figure 6-25 Weibull Plot:
VS ±6V and Gain = 10 - Channel 1
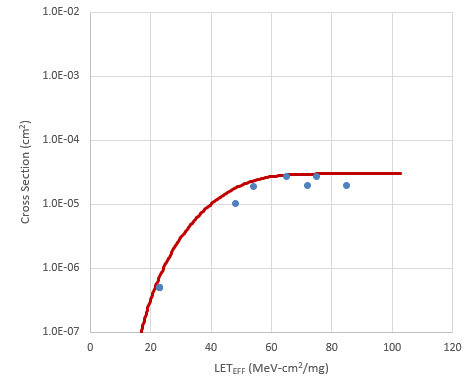 Figure 6-27 Weibull Plot:
VS ±6V and Gain = 10 - Channel 3
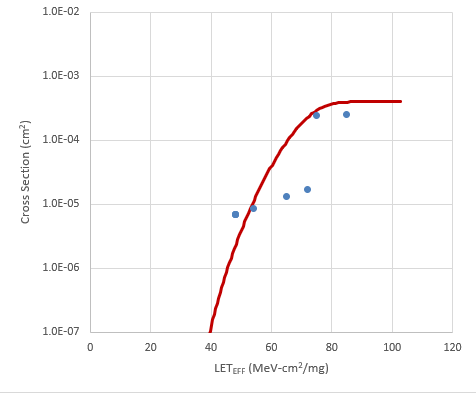 Figure 6-14 Weibull Plot:
VS ±1.35V and Gain = 1 - Channel 2
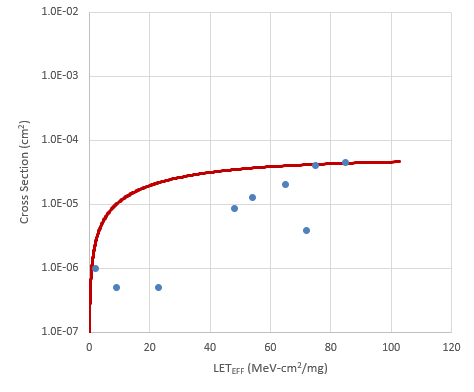 Figure 6-16 Weibull Plot:
VS ±1.35V and Gain = 1 - Channel 4
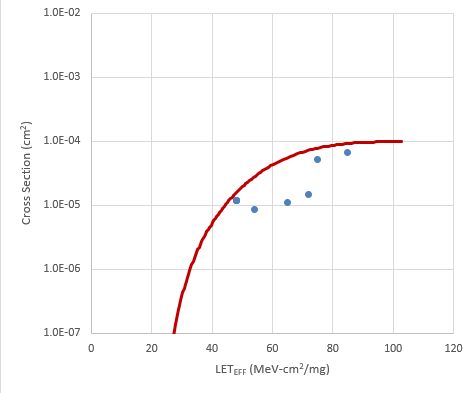 Figure 6-18 Weibull Plot:
VS ±6V and Gain = 1 - Channel 2
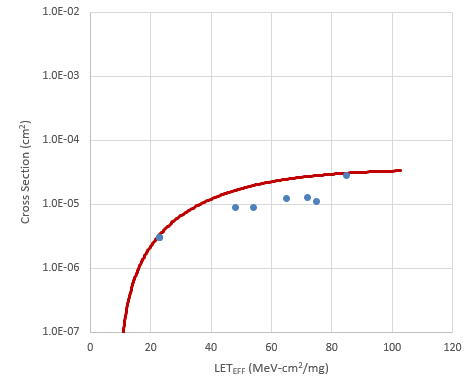 Figure 6-20 Weibull Plot:
VS ±6V and Gain = 1 - Channel 4
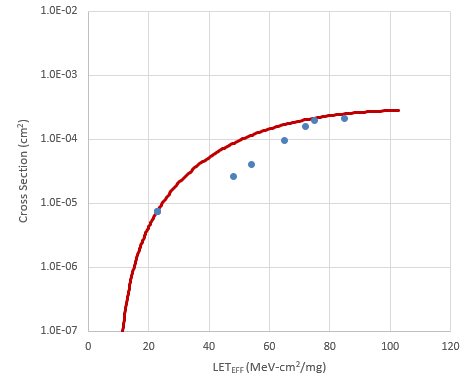 Figure 6-22 Weibull Plot:
VS ±1.35V and Gain = 10 - Channel 2
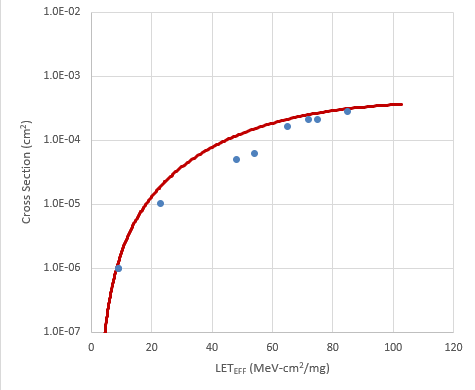 Figure 6-24 Weibull Plot:
VS ±1.35V and Gain = 10 - Channel 4
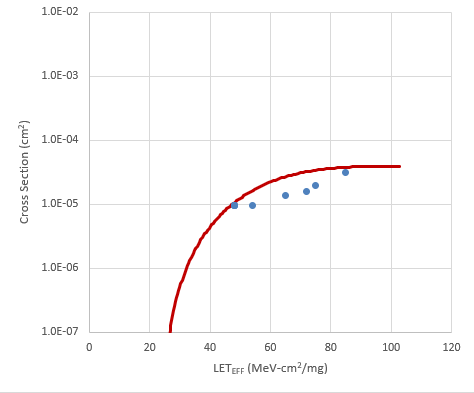 Figure 6-26 Weibull Plot:
VS ±6V and Gain = 10 - Channel 2
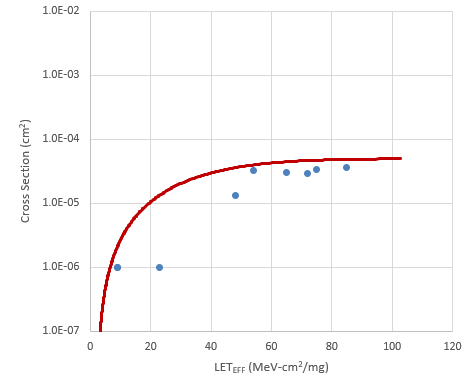 Figure 6-28 Weibull Plot:
VS ±6V and Gain = 10 - Channel 4