SNVA881 November 2019 LP87521-Q1 , LP87522-Q1 , LP87523-Q1 , LP87524-Q1 , LP87525-Q1 , LP87561-Q1 , LP87562-Q1 , LP87563-Q1 , LP87564-Q1 , LP87565-Q1
5.2 Simulation Results
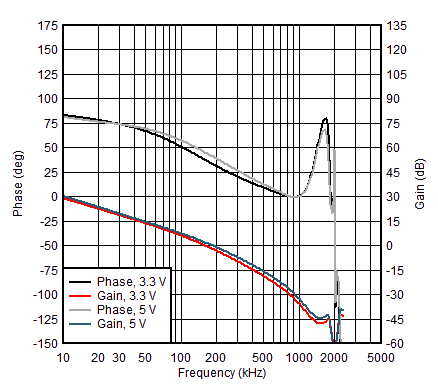
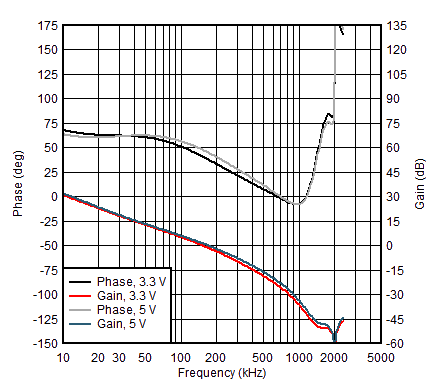
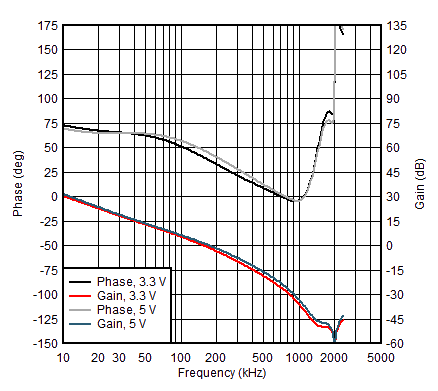
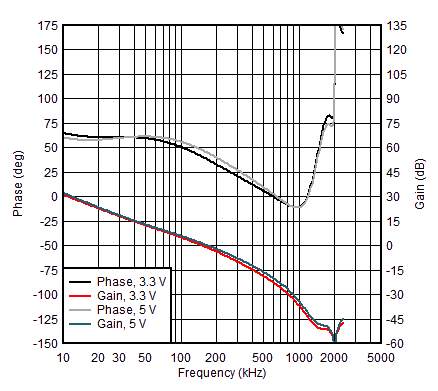
Same configurations that were measured and plotted in Figure 2, Figure 3, Figure 4 and Figure 5 were simulated and plotted in Figure 7, Figure 8, Figure 9 and Figure 10. Configurations had 44 µF of point of load capacitance per phase in every phase configuration.
 Figure 7. VOUT=1000 mV, CPOL=44 µF/phase, 1-phase configuration
 Figure 9. VOUT=1000 mV, CPOL=44 µF/phase, 3-phase configuration
 Figure 8. VOUT=1000 mV, CPOL=44 µF/phase, 2-phase configuration
 Figure 10. VOUT=1000 mV, CPOL=44 µF/phase, 4-phase configuration
All simulation results are listed in Table 8, Table 9, Table 10 and Table 11.
Table 8. Simulated gain and phase margins for 1-phase configuration
| VIN (V) | VOUT (mV) | CPOL (µF/phase) | Bandwidth (kHz) | Gain margin (dB) | Phase margin (deg) |
|---|---|---|---|---|---|
| 3.3 | 860 | 22 | 202.1 | 43.5 | 34.1 |
| 44 | 158.3 | 28.7 | 37.9 | ||
| 91 | 109.7 | 64.0 | 45.1 | ||
| 1000 | 22 | 203.5 | 43.4 | 33.7 | |
| 44 | 159.1 | 30.1 | 37.6 | ||
| 91 | 110.1 | 65.0 | 45.0 | ||
| 1800 | 22 | 211.6 | 42.8 | 33.8 | |
| 44 | 164.2 | 29.0 | 38.2 | ||
| 91 | 112.2 | 85.9 | 46.1 | ||
| 5.0 | 860 | 22 | 235.5 | 40.6 | 36.9 |
| 44 | 182.4 | 27.3 | 41.3 | ||
| 91 | 124.0 | 58.7 | 49.4 | ||
| 1000 | 22 | 236.3 | 40.3 | 36.4 | |
| 44 | 183.4 | 27.3 | 41.0 | ||
| 91 | 124.5 | 57.4 | 49.2 | ||
| 1800 | 22 | 243.9 | 39.6 | 36.1 | |
| 44 | 188.1 | 28.1 | 41.2 | ||
| 91 | 126.6 | 57.9 | 49.8 | ||
| 3300 | 22 | 263.9 | 38.7 | 38.9 | |
| 44 | 199.8 | 46.6 | 44.3 | ||
| 91 | 131.5 | 85.2 | 53.0 |
Table 9. Simulated gain and phase margins for 2-phase configuration
| VIN (V) | VOUT (mV) | CPOL (µF/phase) | Bandwidth (kHz) | Gain margin (dB) | Phase margin (deg) |
|---|---|---|---|---|---|
| 3.3 | 860 | 22 | 197.9 | 69.1 | 35.7 |
| 44 | 152.4 | 25.6 | 40.2 | ||
| 91 | 102.9 | 68.0 | 47.8 | ||
| 1000 | 22 | 199.6 | 68.6 | 35.7 | |
| 44 | 153.4 | 25.8 | 40.4 | ||
| 91 | 103.3 | 67.6 | 48.0 | ||
| 1800 | 22 | 207.4 | 68.1 | 37.0 | |
| 44 | 158.1 | 25.9 | 42.0 | ||
| 91 | 105.1 | 67.4 | 49.8 | ||
| 5.0 | 860 | 22 | 225.7 | 68.8 | 39.2 |
| 44 | 171.6 | 24.8 | 44.3 | ||
| 91 | 113.3 | 74.0 | 52.3 | ||
| 1000 | 22 | 227.4 | 68.8 | 39.2 | |
| 44 | 172.6 | 25.2 | 44.4 | ||
| 91 | 113.8 | 74.4 | 52.4 | ||
| 1800 | 22 | 235.8 | 67.7 | 40.3 | |
| 44 | 177.4 | 24.9 | 45.7 | ||
| 91 | 115.7 | 73.1 | 53.7 | ||
| 3300 | 22 | 252.1 | 68.5 | 43.7 | |
| 44 | 186.9 | 24.0 | 49.4 | ||
| 91 | 119.2 | 75.1 | 57.1 |
Table 10. Simulated gain and phase margins for 3-phase configuration
| VIN (V) | VOUT (mV) | CPOL (µF/phase) | Bandwidth (kHz) | Gain margin (dB) | Phase margin (deg) |
|---|---|---|---|---|---|
| 3.3 | 860 | 22 | 196.8 | 27.5 | 35.9 |
| 44 | 150.6 | 24.2 | 40.7 | ||
| 91 | 100.7 | 32.8 | 48.3 | ||
| 1000 | 22 | 198.4 | 28.1 | 36.0 | |
| 44 | 151.5 | 24.1 | 40.9 | ||
| 91 | 101.0 | 33.9 | 48.6 | ||
| 1800 | 22 | 205.8 | 52.7 | 37.7 | |
| 44 | 155.9 | 24.2 | 42.9 | ||
| 91 | 102.6 | 52.1 | 50.6 | ||
| 5.0 | 860 | 22 | 222.3 | 26.3 | 39.5 |
| 44 | 168.0 | 23.2 | 44.8 | ||
| 91 | 110.0 | 52.0 | 52.7 | ||
| 1000 | 22 | 223.9 | 26.8 | 39.6 | |
| 44 | 168.9 | 23.1 | 45.0 | ||
| 91 | 110.3 | 52.1 | 52.9 | ||
| 1800 | 22 | 231.9 | 26.5 | 41.0 | |
| 44 | 173.5 | 22.9 | 46.5 | ||
| 91 | 112.1 | 52.7 | 54.4 | ||
| 3300 | 22 | 248.9 | 53.3 | 45.0 | |
| 44 | 183.0 | 22.5 | 50.7 | ||
| 91 | 115.6 | 53.8 | 58.0 |
Table 11. Simulated gain and phase margins for 4-phase configuration
| VIN (V) | VOUT (mV) | CPOL (µF/phase) | Bandwidth (kHz) | Gain margin (dB) | Phase margin (deg) |
|---|---|---|---|---|---|
| 3.3 | 860 | 22 | 195.4 | 23.8 | 35.6 |
| 44 | 149.2 | 22.6 | 40.6 | ||
| 91 | 99.4 | 29.2 | 48.3 | ||
| 1000 | 22 | 196.4 | 24.3 | 35.8 | |
| 44 | 149.8 | 22.7 | 40.8 | ||
| 91 | 99.6 | 29.5 | 48.6 | ||
| 1800 | 22 | 204.2 | 23.6 | 37.8 | |
| 44 | 154.3 | 22.8 | 43.1 | ||
| 91 | 101.2 | 30.2 | 50.8 | ||
| 5.0 | 860 | 22 | 221.1 | 22.8 | 39.4 |
| 44 | 166.4 | 22.0 | 44.8 | ||
| 91 | 108.4 | 29.6 | 52.7 | ||
| 1000 | 22 | 221.8 | 22.5 | 39.6 | |
| 44 | 166.7 | 21.5 | 44.9 | ||
| 91 | 108.5 | 28.9 | 52.8 | ||
| 1800 | 22 | 230.0 | 22.8 | 41.1 | |
| 44 | 171.5 | 21.6 | 46.7 | ||
| 91 | 110.4 | 30.0 | 54.5 | ||
| 3300 | 22 | 246.4 | 22.3 | 45.2 | |
| 44 | 180.4 | 21.5 | 50.9 | ||
| 91 | 113.5 | 60.7 | 58.2 |