SPRAD28 October 2022 AM2431 , AM2432 , AM2434 , AM2631 , AM2631-Q1 , AM2632 , AM2632-Q1 , AM2634 , AM2634-Q1 , AM263P4 , AM263P4-Q1 , AM26C31 , AM26C31-EP , AM26C31M , AM26C32 , AM26C32-EP , AM26C32C , AM26C32M , AM26LS31 , AM26LS31M , AM26LS32A , AM26LS32AC , AM26LS32AM , AM26LS33A , AM26LS33A-SP , AM26LS33AM , AM26LV31 , AM26LV31E , AM26LV31E-EP , AM26LV32 , AM26LV32E , AM26LV32E-EP , AM26S10 , AM2732 , AM2732-Q1
- Abstract
- Trademarks
- 1 Building for Debug
- 2 Code Composer Studio Stop-Mode Debugging
- 3 Debug Logging
- 4 Multi-Core Debug
- 5 Debugging Arm Cortex-R5 Exceptions
- 6 Debugging Arm Cortex-M4 Exceptions
- 7 Debugging Memory
- 8 Debugging Boot
- 9 Debugging Real-Time Control Loops
- 10E2E Support Forums
7.5 Understanding Your Application's Memory Allocation
The Memory Allocation View in Code Composer Studio provides a graphical representation of how much memory is consumed by your application.
To open the view, go to the CCS menu View -> Memory Allocation.

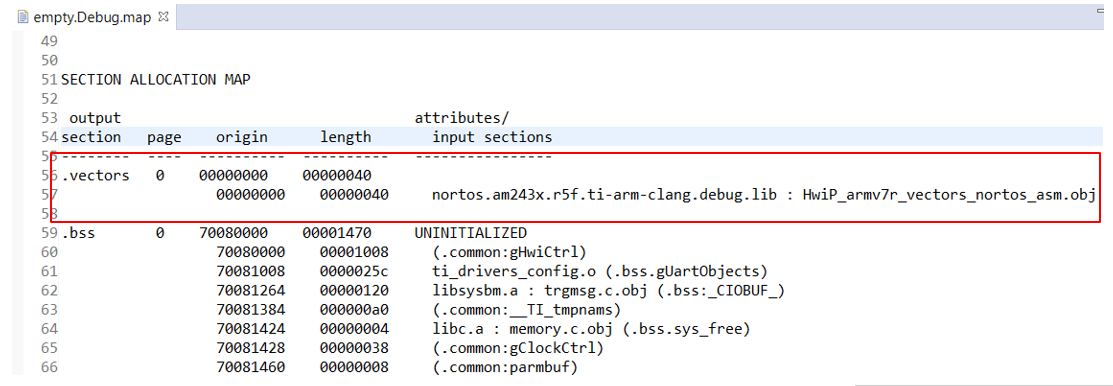
By default, the view shows the memory used relative to the total available memory for the project that is active in the Project Explorer view. You can expand each memory region to see how much memory each individual section or sub-section is using. Another method to debug memory allocation to understand where the memory sections you configured in linker.cmd are actually allocated, is to look at the Debug.map file under Debugà”project_name ”.Debug.map.
For example, in the Am243x linker.cmd file, there is a default section called “vectors”:
SECTIONS
{
.vectors:{} palign(8) > R5F_VECS
...
...
...
}
To understand where exactly this section is allocated and what it contains, check the Debug.map file.

There, this is a specific case, the vectors are located in address 0x00, and contains an object called “HwiP_armv7r_vectors_nortos_asm.obj” from a library named “nortos.am243x.r5f.ti-arm-clang.debug.lib”.