SPRUHW1A June 2014 – October 2021 TMS320F28052-Q1 , TMS320F28052M , TMS320F28052M-Q1 , TMS320F28054-Q1 , TMS320F28054M , TMS320F28054M-Q1
- 1Read This First
- 1 F2805xM InstaSPIN-MOTION Enabled MCUs
- 2InstaSPIN-MOTION Key Capabilities and Benefits
- 3InstaSPIN-MOTION Block Diagrams
- 4Application Examples
- 5Evaluating InstaSPIN-MOTION Performance
- 6Microcontroller Resources
5.2.3 Step Response
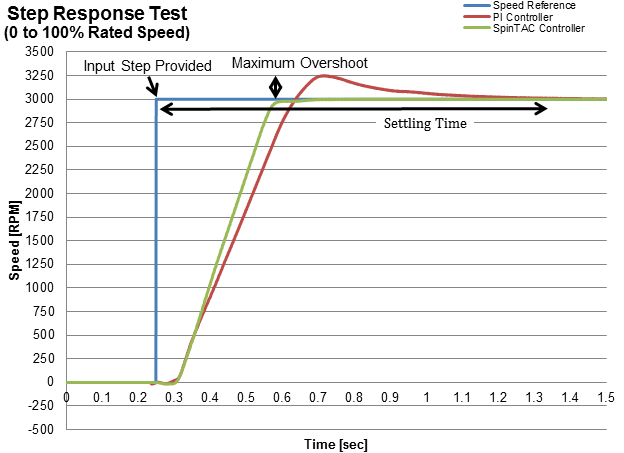
Step response tests how quickly a controller can respond to a sudden input change. The two metrics to evaluate during this testing are settling time and maximum overshoot. This test is also a measure of stability of your controller. If the controller oscillates upon reaching the goal speed, then it is not very stable.
A step profile was applied to each controller. This step input bypassed the profile generator. The following parameters were measured:
- Settling Time (from the step input until within 2% of the target speed): The settling time reflects how long it takes the controller to reach the goal speed and bring the speed of the motor within a narrow band around the goal speed.
- Maximum Overshoot: The maximum speed the motor reaches after the step input.
Figure 6-9 compares the step responses of the SpinTAC and PI controllers. It also gives a visual representation of how these metrics were calculated. The SpinTAC controller was able to reach the goal speed with zero overshoot and the minimal amount of settling time. It achieved the minimal amount of settling time because the controller did not allow the motor speed to exceed the goal speed.
 Figure 5-9 Step Response
Test of Maximum Overshoot and Settling Time
Figure 5-9 Step Response
Test of Maximum Overshoot and Settling Time| Settling Time(s) | Overshoot (rpm) | ||||
|---|---|---|---|---|---|
| SpinTAC | PI | SpinTAC Advantage (percentage improvement over PI) | SpinTAC | PI | SpinTAC Advantage (percentage improvement over PI) |
| 0-4000 rpm | |||||
| 2.67 | 3.45 | 22.66 | 73 | 140.4 | 48.01 |
| 2.48 | 3.39 | 26.84 | 71.5 | 139.6 | 48.78 |
| 2.52 | 3.51 | 28.21 | 70.1 | 138.2 | 49.28 |
| 2.54 | 3.59 | 29.25 | 71.5 | 138.2 | 48.26 |
| 2.64 | 3.39 | 22.12 | 70.1 | 139.6 | 49.79 |
| 0-2000 rpm | |||||
| 0.84 | 1.51 | 44.37 | 317 | 319.6 | 0.81 |
| 0.9 | 1.42 | 36.62 | 325 | 320.3 | -1.47 |
| 0.86 | 1.42 | 39.44 | 332 | 320.3 | -3.65 |
| 0.93 | 1.45 | 35.86 | 390 | 320.3 | -21.76 |
| 0.92 | 1.42 | 35.21 | 325 | 319.6 | -1.69 |
| 0-1000 rpm | |||||
| 0.65 | 1.28 | 49.38 | 239 | 316.2 | 24.41 |
| 0.79 | 1.1 | 28.18 | 269 | 317.6 | 15.3 |
| 0.57 | 1.27 | 55.12 | 195 | 319.1 | 38.89 |
| 0.59 | 1.38 | 57.25 | 203 | 318.4 | 36.24 |
| 0.59 | 1.18 | 50 | 24.16 | 318.4 | 38.76 |
| Settling Time(s) | Overshoot (rpm) | ||||
|---|---|---|---|---|---|
| SpinTAC | PI | SpinTAC Advantage (percentage improvement over PI) | SpinTAC | PI | SpinTAC Advantage (percentage improvement over PI) |
| 0-3000 rpm | |||||
| 0.44 | 1.16 | 61.81 | 2.9 | 250.5 | 98.84 |
| 0.54 | 1.1 | 50.91 | 2.9 | 251.2 | 98.85 |
| 0.38 | 1.32 | 71.21 | 2.9 | 252.7 | 98.85 |
| 0.4 | 1.21 | 66.94 | 2.9 | 252 | 98.85 |
| 0.42 | 1.41 | 70.21 | 2.9 | 252.7 | 98.85 |
| 0-1500 rpm | |||||
| 0.25 | 1.12 | 78 | 3.7 | 261.5 | 98.59 |
| 0.37 | 1.3 | 71.54 | 19 | 262.2 | 92.75 |
| 0.47 | 1.12 | 58.04 | 3.7 | 263.7 | 98.6 |
| 0.42 | 1.1 | 61.82 | 3.7 | 263.7 | 98.6 |
| 0.44 | 1.13 | 61.06 | 3.7 | 262.9 | 98.59 |
| 0-750 rpm | |||||
| 0.41 | 0.81 | 49.63 | 63.72 | 286.4 | 77.75 |
| 0.32 | 0.61 | 47.54 | 76.17 | 179.44 | 57.55 |
| 0.43 | 0.71 | 39.44 | 71.04 | 279.8 | 74.61 |
| 0.32 | 0.62 | 48.39 | 13.91 | 292.2 | 95.24 |
| 0.32 | 0.73 | 56.16 | 24.16 | 177.97 | 86.42 |