SPRUIK4A September 2018 – June 2019 TMS320F280021 , TMS320F280021-Q1 , TMS320F280023 , TMS320F280023-Q1 , TMS320F280023C , TMS320F280025 , TMS320F280025-Q1 , TMS320F280025C , TMS320F280025C-Q1 , TMS320F280040-Q1 , TMS320F280040C-Q1 , TMS320F280041 , TMS320F280041-Q1 , TMS320F280041C , TMS320F280041C-Q1 , TMS320F280045 , TMS320F280048-Q1 , TMS320F280048C-Q1 , TMS320F280049 , TMS320F280049-Q1 , TMS320F280049C , TMS320F280049C-Q1 , TMS320F28075 , TMS320F28075-Q1 , TMS320F28076 , TMS320F28374D , TMS320F28374S , TMS320F28375D , TMS320F28375S , TMS320F28375S-Q1 , TMS320F28376D , TMS320F28376S , TMS320F28377D , TMS320F28377D-Q1 , TMS320F28377S , TMS320F28377S-Q1 , TMS320F28378D , TMS320F28378S , TMS320F28379D , TMS320F28379D-Q1 , TMS320F28379S
-
C2000 Software Frequency Response Analyzer (SFRA) Library and Compensation Designer in SDK Framework
- Trademarks
- 1 Introduction
- 2 Installing the SFRA Library
- 3 Module Summary
- 4 Compensation Designer
- 5 Case Study
- 6 Running Software Test Bench Example for SFRA
- 7 Using SFRA Without SFRA GUI Integration
- 8 FAQ
- Revision History
5.3 OL Measurement
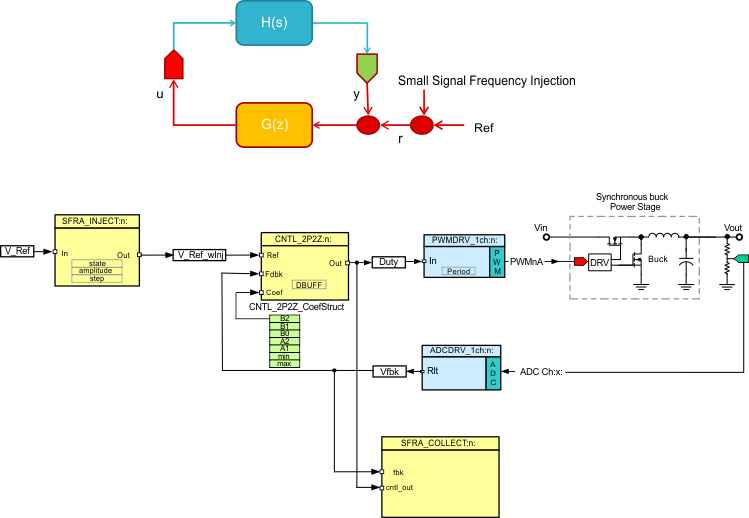
The designed compensator can then be implemented on the controller and the SFRA library can be used to measure the open loop frequency response of the closed loop power converter.Figure 13 describes the software connections for a closed loop system using SFRA.
 Figure 13. Closed Loop SFRA Software Diagram
 - Once the code is running, to run SFRA, open the SFRA_GUI.exe, located in the GUI folder under the SFRA install directory. Select "floating point" math for devices such as F28004x, F2837x.
- Click Setup Connection and set the baud rate to be 57600 on the pop up window.
- Uncheck boot on connect and select the appropriate COM port. For the procedure to find out which COM port to select, see Section 3.6.
- Click OK to close the pop-up window and return to the main screen.
- On the Main Window, click Connect. Once connected, the GUI will parse the current settings for the FRA sweep from the controller. These include the Start Frequency of the sweep, the length of the frequency sweep array (this is fixed in the code and cannot be changed through the GUI), injection amplitude and steps per decade. Leave these as default for now.
- Press the Start Sweep button.
- Wait for the status bar in the GUI to change to Sweep Complete.
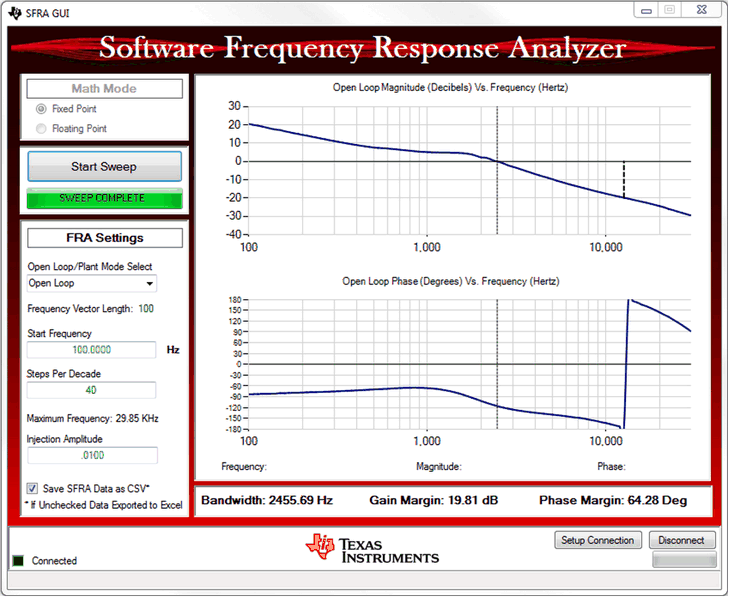
- The results of the SFRA sweep are displayed on the large panel in the SFRA GUI. The control performance parameter like open loop gain cross over frequency gain margin and phase margin are also reported in a panel on the SFRA GUI. It is noted that the values reported match closely to what the system was designed for using the Plant Frequency Response Data from the open loop run.
- Drag your mouse across either of the graphs to locate the values at specific frequencies used in the Frequency Response Analysis.
- A SFRAData.csv file inside the GUI folder is updated with the latest run of the SFRA library. All runs of the SFRA library and time stamps are saved under that folder. If the checkbox “Save SFRA Data as CSV” is unchecked, the excel sheet will pop up after each sweep with the data of the frequency response. Each subsequent sweep is added as a new page on the excel sheet.
- Critical values like Bandwidth, gain margin and phase margin are brought out on the GUI. The values can be used to verify whether or not the designed compensation really met the goals.
- Once finished, put SW1 in the OFF position, and the code can be halted and CCS debug session stopped.
The closed loop control ISR will look like the code shown below with the SFRA routines added.
interrupt void PWM_ISR(void)
{
….
//
// Read ADC and computer Fbk Value
//
Vout1_Read = (float32)Vout1R/(4096.0);

//
// Add SFRA injection into the reference of the controller
//
Vout1_Ref_wInj= SFRA_F32_inject(Vout1_Ref);

//
// Call the controller
//
gi_out=DCL_runPI_C1(&gi,Vout1_Ref_wInj,SFRA_F32_inject(Vout1_Read));

//
// Update PWM value
//
EPwm1Regs.CMPA.half.CMPA=((long)(BUCK_PWM_PERIOD))* gi_out;

SFRA_F32_collect(&gi_out,&Vout1_Read);
.....
}
 Figure 14. SFRA GUI With OL Frequency Response Plot
 NOTE
The change to the checkbox will only affect the save of the next run of the SFRA. The selection must be done before hitting “Start Sweep”.