SSZT740 April 2018 CC3120
Many motors and pumps are critical in factory production; a functional failure might cause a complete line stop. To avoid this, there are usually extensive preventive maintenance plans in place that require work at regular intervals. These plans are based on lifetime statistics and not on the actual condition of the equipment.
If you know the condition of the equipment, you can reduce maintenance costs as well as the risk of an unexpected breakdown. Using this knowledge to schedule repair and replacement is called predictive maintenance.
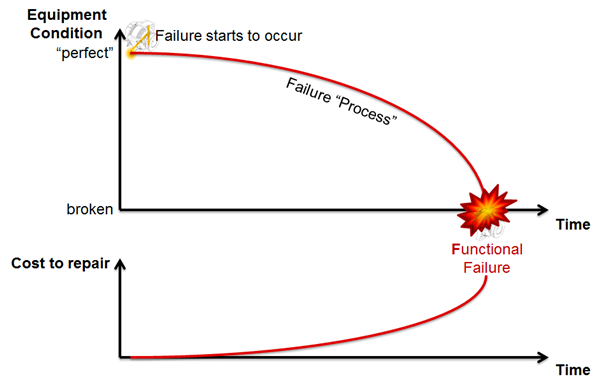
The Process toward Failure
 Figure 1 Failure Process and Cost to Repair
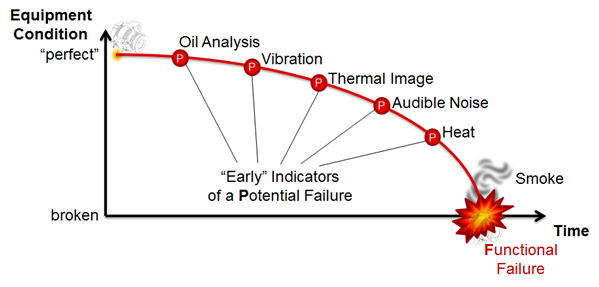
Early Indicators of Failure
- Oil analysis (months).
- Vibration (weeks to months).
- Power (weeks to months)
- Thermal image (weeks).
- Audible noise (days to weeks).
- Heat (days).
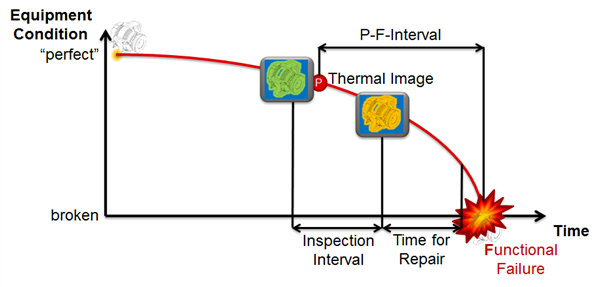
Obviously, the earlier you can detect a potential failure, the more time you have to react, plan and execute equipment maintenance (Figure 2).
 Figure 2 P-F Curve – Potential Failure to Functional Failure
From Regular Inspections to Continuous Condition Monitoring
 Figure 3 Inspection Interval
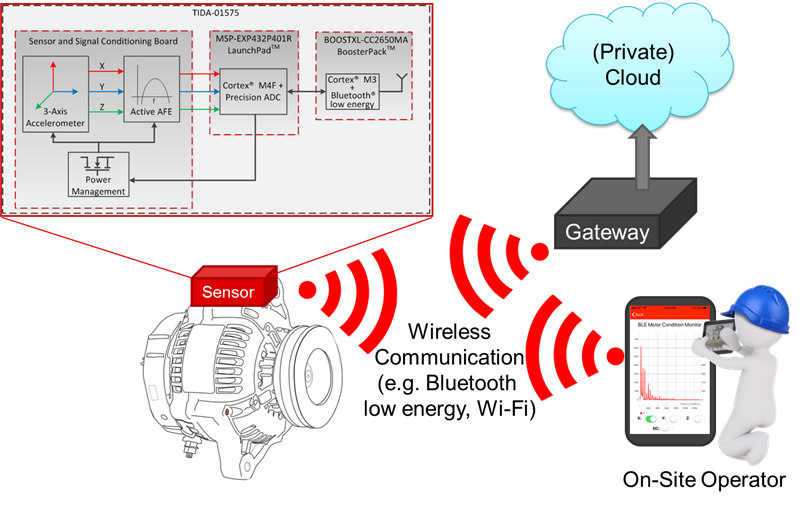
Vibration Condition Monitoring
 Figure 4 Vibration Condition Monitoring Setup
Conclusion
Additional Resources
- Get up to speed on the MSP432P4’s integrated precision ADC by reading these application reports:
- “Low-Power Analog Measurements with SimpleLink™ MSP432™ Microcontrollers.”
- “Precision ADC with 16-Bit Performance.”
- The application reports “Leveraging Precision ADC on SimpleLink MSP432 Microcontrollers for Predictive Maintenance” and “Signal Processing with MSP432 Microcontroller and CMSIS-DSP Library” offer more details about the software that processes the measured data.
- To help you develop wireless connectivity solutions for the MSP432P4 host MCU, refer to the examples in the SimpleLink MSP432P4 Software Development Kit (SDK), the Bluetooth Plugin for SimpleLink MCU SDK and the SimpleLink WI-FI® CC3120 SDK Plugin.
- The Wireless Mesh Network for Predictive Maintenance Reference Design (TIDA-01439) provides an alternative RF technology and hardware platform for predictive maintenance.