SSZTAT0 October 2016 LM4041-N
Manjing Xie
Whenever a system incorporates a negative feedback loop, the loop gain, T, becomes an important performance parameter to measure and optimize for stability, output regulation and transient-response performance. Voltage injection is a widely adopted method for measuring T. Figure 1 shows a typical voltage-injection T measurement setup. The feedback path is cut off between VOUT and Rup. A disturbance voltage is inserted. All signals refer to ground.
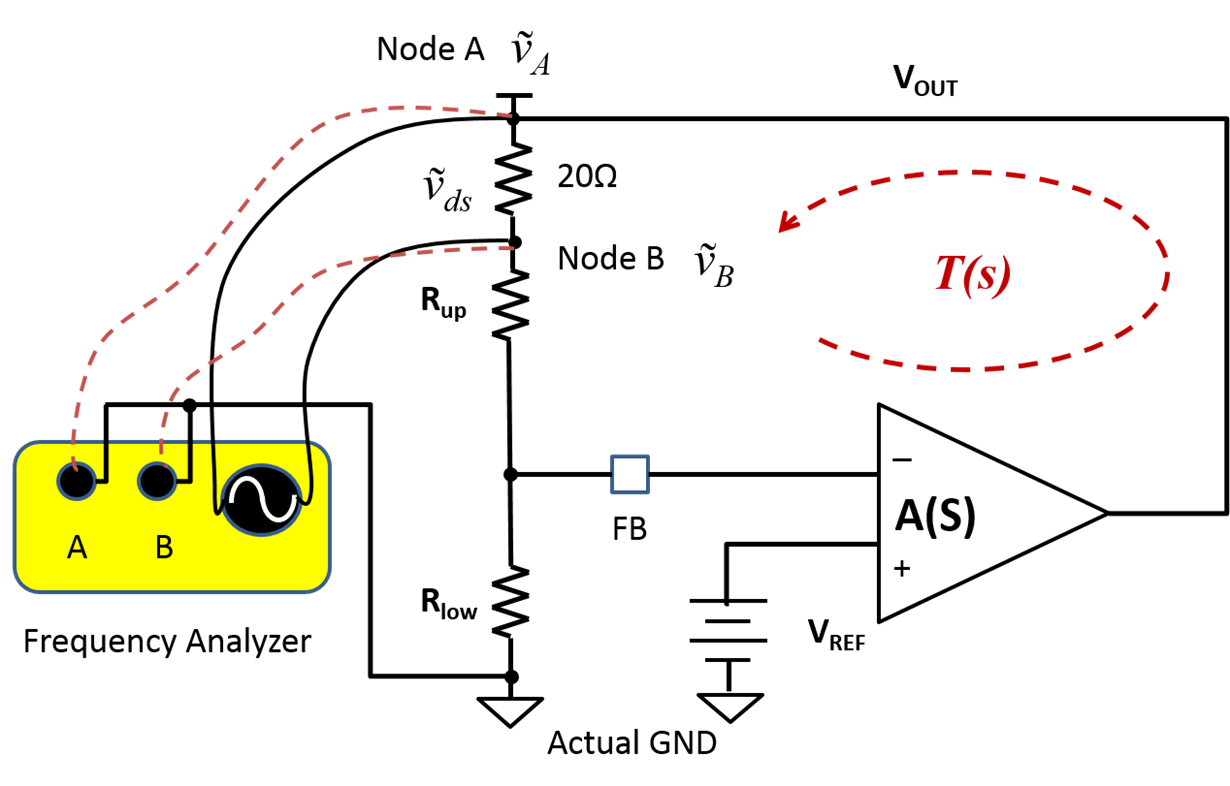 Figure 1 Typical T Measurement
Setup
Figure 1 Typical T Measurement
SetupFigure 1 measures T as:

Signal receivers A and B have two leads which provide a reference point for signals A and B, respectively. Figure 2 shows the leads.
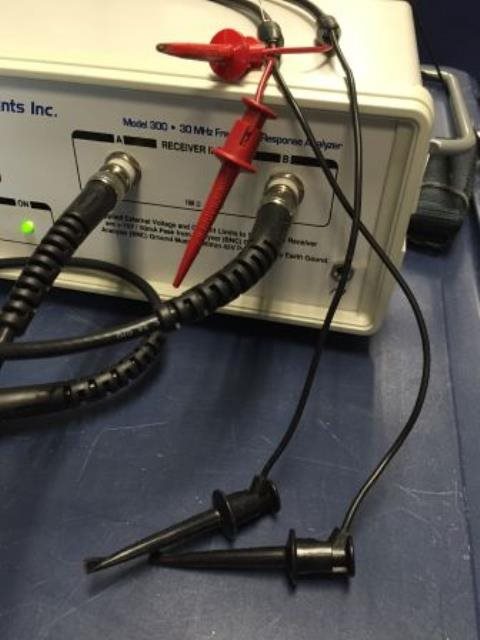 Figure 2 Probes of Receivers a and B
with Their Reference Leads
Figure 2 Probes of Receivers a and B
with Their Reference LeadsIn most cases, these leads connect to ground, and because of that, they are called GND leads. But is that always the case? To answer that question, I will demonstrate an example using the LM4041-N, a precision shunt voltage reference. Figure 3 shows a typical application circuit for the LM4041-N.
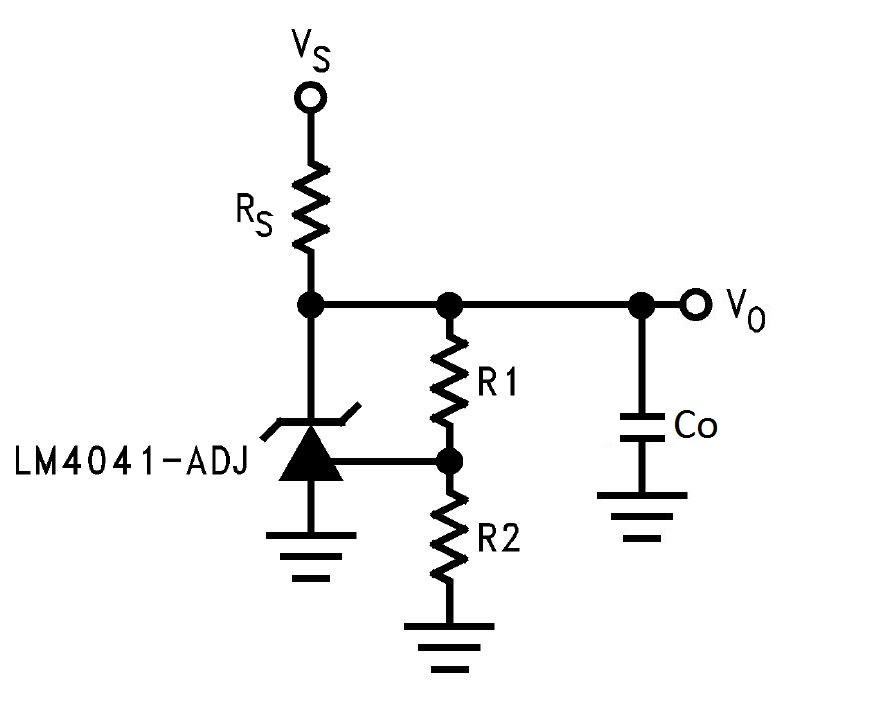 Figure 3 LM4041-N Typical Application
Circuit
Figure 3 LM4041-N Typical Application
CircuitThe LM4041-N keeps the voltage across VO to the FB pin at 1.24V, as Figure 4 shows. The resistor divider sets the output DC voltage. RS provides current for the LM4041-N and load.
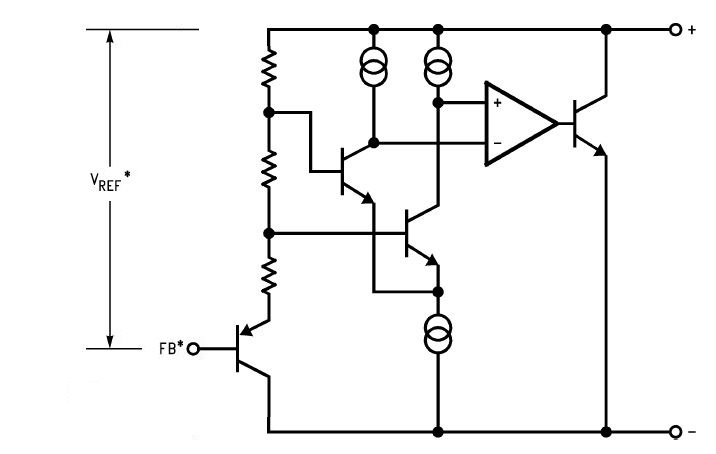 Figure 4 LM4041-N Block Diagram
To generate a 2.5V reference from a 12V bus, I used these components:
- R1 = 10kΩ.
- R2 = 10kΩ.
- RS = 10kΩ.
- Co = 0.22µF.
Figure 5 shows the Bode plot measurement result using the setup shown in Figure 1. The result does not correspond to tight DC regulation, as I expected. Nor does it provide a direct indication of stability.
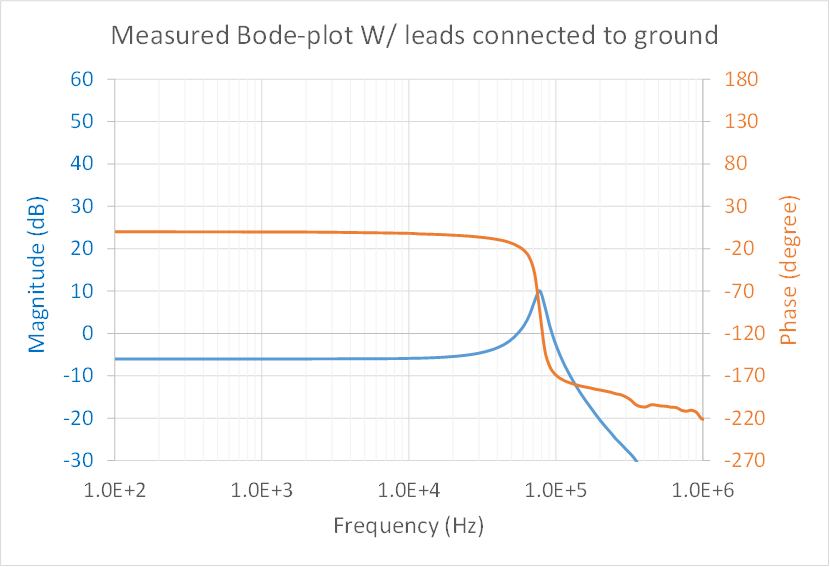 Figure 5 Measured Bode Plot with
Reference Leads Connected to Ground
Figure 5 Measured Bode Plot with
Reference Leads Connected to GroundI derived the AC small-signal models referring to ground. Figure 6 shows the model.
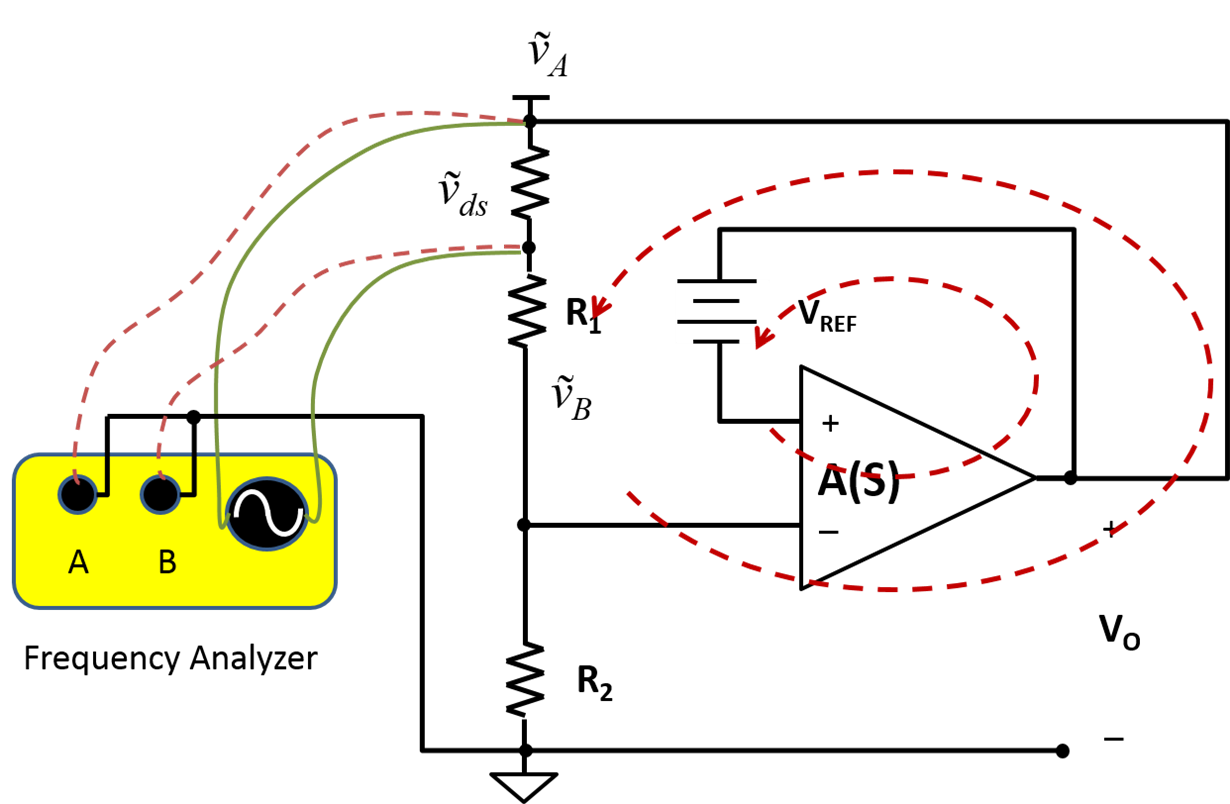 Figure 6 Small-signal Model Referring
to Ground
Figure 6 Small-signal Model Referring
to GroundWith the reference leads connected to ground, the break point between Vo and R1 only cutting off part of the feedback path. I examined the LM4041-N block diagram. The positive input of the gain stage connects to Vo from the AC perspective. By moving the reference leads to Vo, I now can break the feedback loop completely between R2 and ground. At this break point, looking backward is the regulator output, RS and Co in parallel. R2 is the impedance looking forward. For most frequencies, the impedance of Co is much smaller than R2. Figure 7 shows the small-signal model referring to Vo.
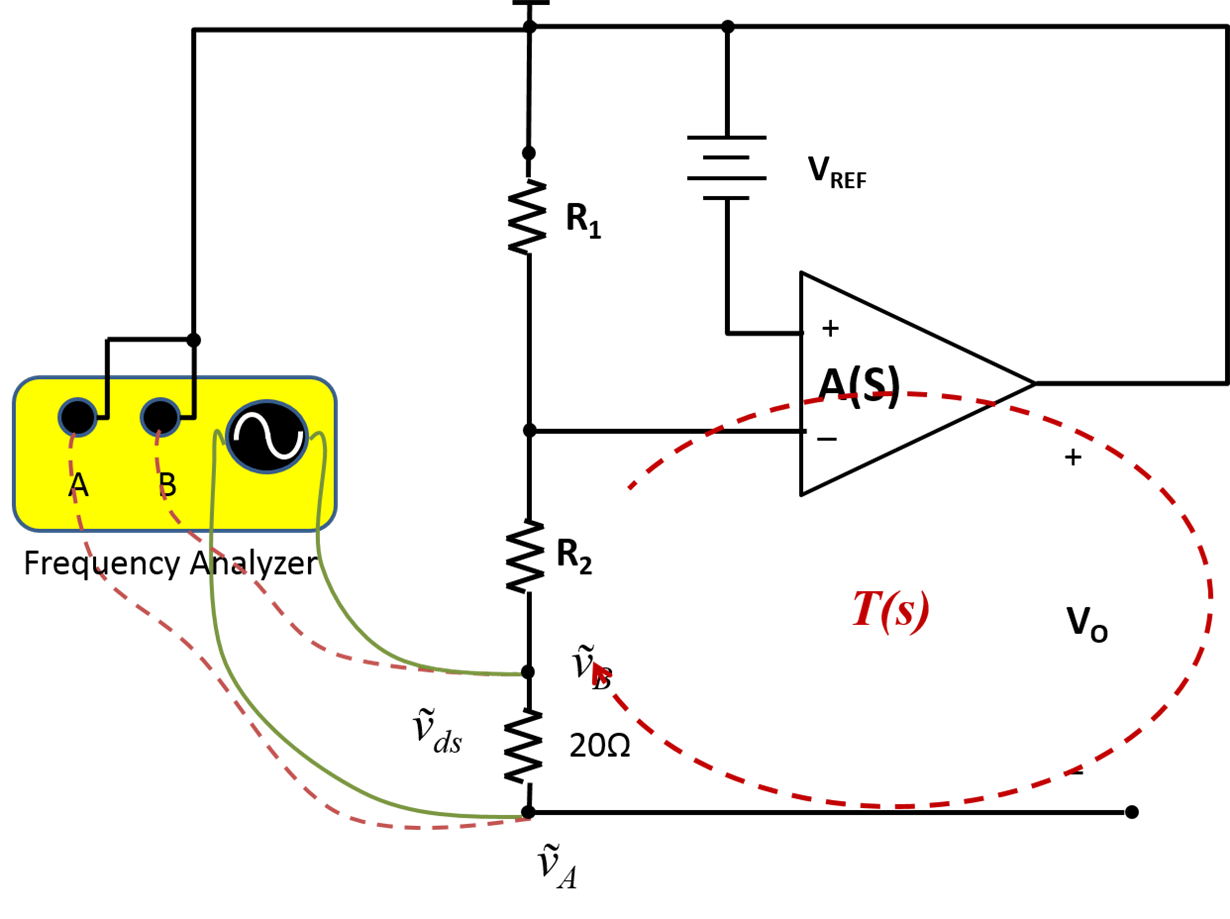 Figure 7 Small-signal Model Referring
to the Output
Figure 7 Small-signal Model Referring
to the OutputFigure 8 shows the measurement results using the setup shown in Figure 7.
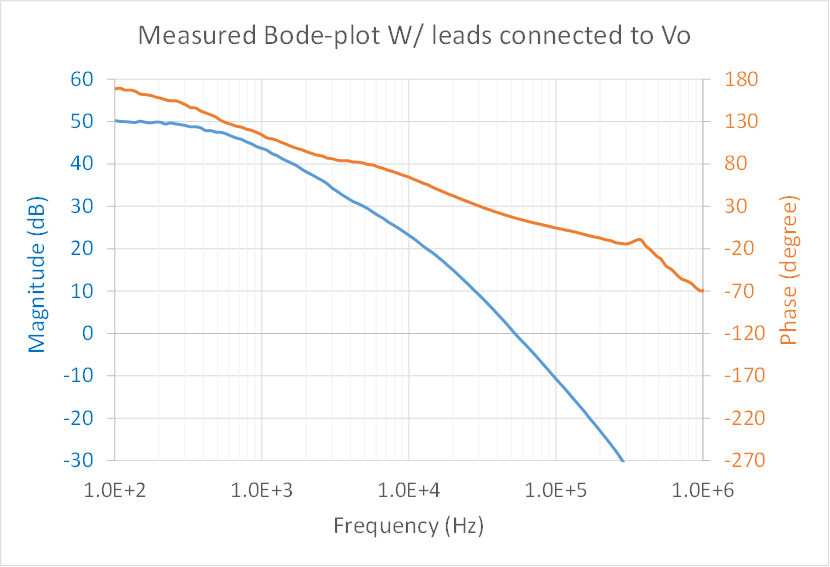 Figure 8 Measured Bode Plot with
Reference Leads Connected to vo
Figure 8 Measured Bode Plot with
Reference Leads Connected to voThe result shown in Figure 8 indicates that the stability needs improving. I reduced the output capacitor from 0.22µF to 47nF and added a phase-boosting capacitor in parallel to R2, as shown in Figure 9.
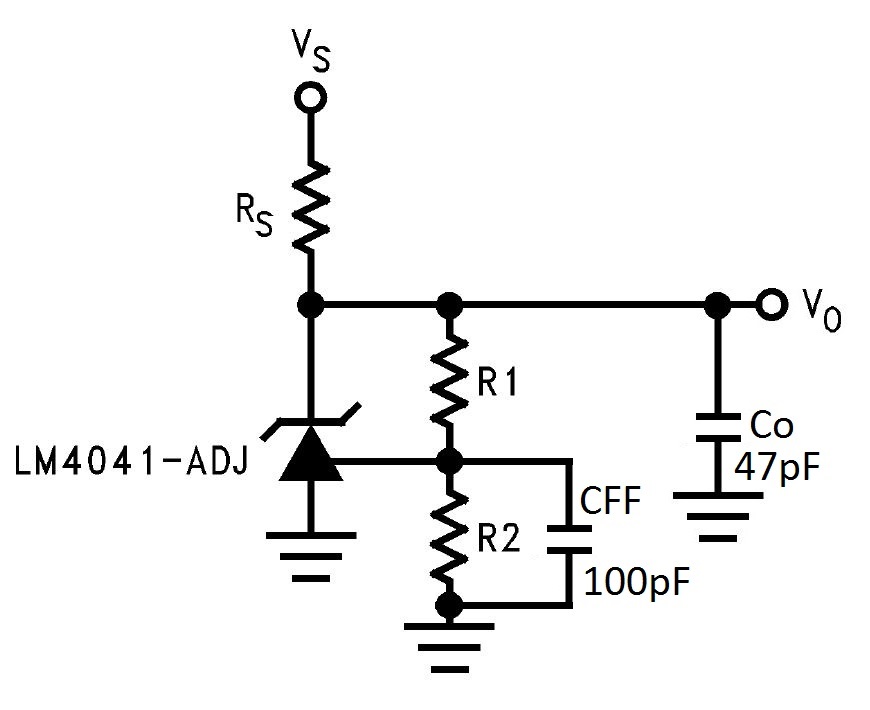 Figure 9 Final Schematic of LM4041-N as
a 2.5V Voltage Reference
Figure 9 Final Schematic of LM4041-N as
a 2.5V Voltage ReferenceFigure 10 shows the improvement with the reduced Co and phase-boost capacitor, Cff. With the changes, phase margin has increased from 16 degree to 45 degree.
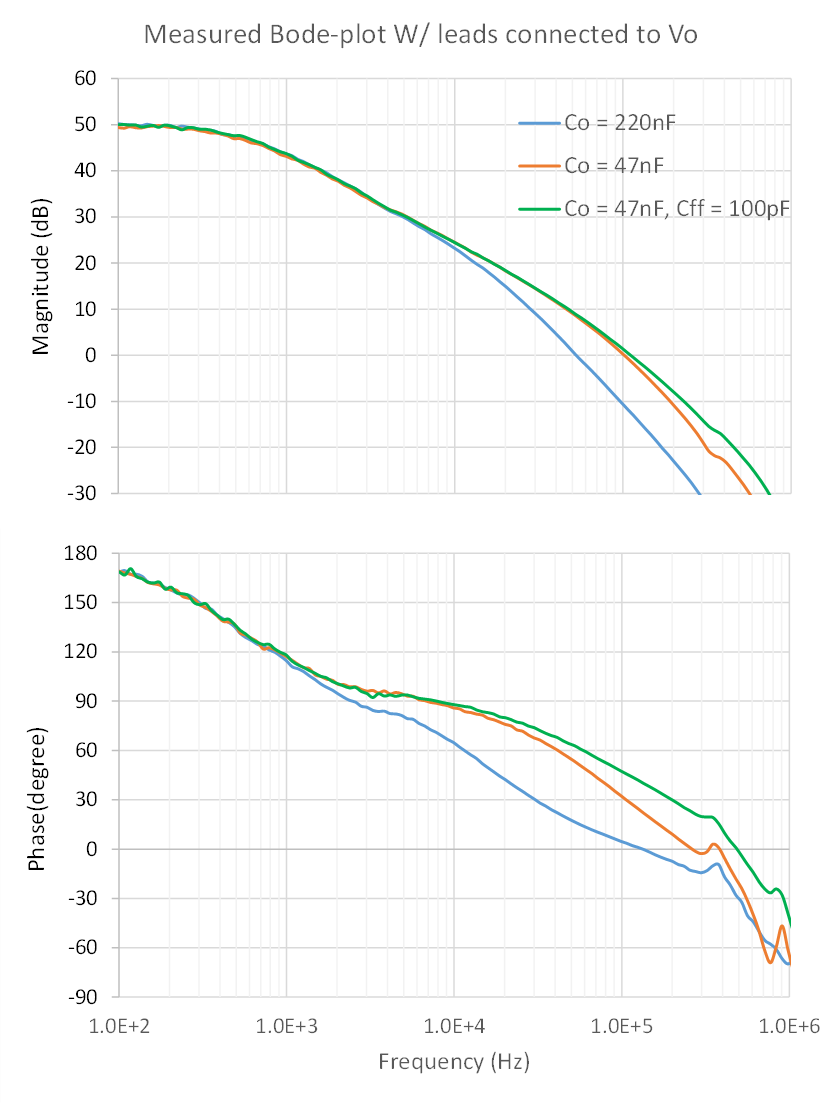 Figure 10 Measured Bode Plot with a
Different Co and Cff
Figure 10 Measured Bode Plot with a
Different Co and CffYou can use the LM4041-N to show how to find a point to connect the reference leads of a frequency analyzer for Bode plot measurement. First, develop an AC small-signal model. Then, identify a reference point so you can find a break point to meet both of these requirements:
- All feedback paths are cut off at the break point.
- The impedance of the break point looking backward is much smaller than the impedance looking forward.
Additional Resources
- Read more Power Tips.
- View Power Tips videos.