SWRA122D January 2007 – September 2018 CC1100 , CC1100E , CC1101 , CC1101-Q1 , CC1110-CC1111 , CC1131-Q1 , CC1151-Q1 , CC430F5123 , CC430F5125 , CC430F5133 , CC430F5135 , CC430F5137 , CC430F5143 , CC430F5145 , CC430F5147 , CC430F6125 , CC430F6126 , CC430F6127 , CC430F6135 , CC430F6137 , CC430F6147
3 PER Versus Frequency Offset
Figure 6 to Figure 12 plot the 1% PER for different data rates and modulation formats. Register FOCCFG.FOC_LIMIT[1:0] = 11b and the RF frequency is 868 MHz in the measurements. Because the signal bandwidth is given, the plots can be used to estimate the maximum frequency offset and hence the required crystal accuracy.
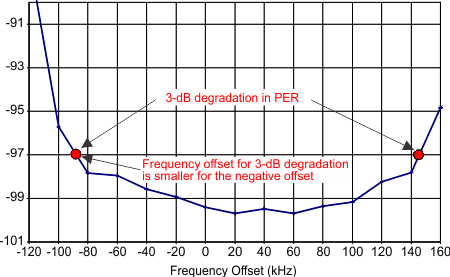
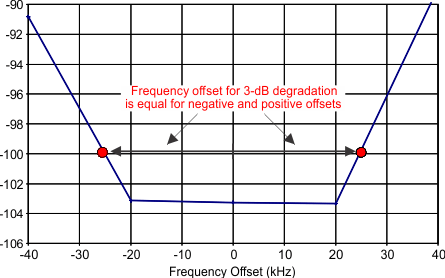
Assuming a 3-dB loss in sensitivity is acceptable, the total frequency offset is estimated as 2 times the frequency offset where a 3-dB degradation in PER is first measured (see Figure 2). In the ideal case the 3-dB degradation in PER should occur at the same positive and negative frequency offsets (see Figure 3). Because the IF frequency is programmed in steps of 25 kHz, this is not always possible.
 Figure 2. Definition of Frequency Offset That Gives 3-dB Degradation on PER (Unsymmetrical Frequency Offset)
  Figure 3. Definition of Frequency Offset That Gives 3-dB Degradation on PER (Symmetrical Frequency Offset)