SWRA478D February 2015 – January 2019 CC1310 , CC1312PSIP , CC1312R , CC1314R10 , CC1352P , CC1352P7 , CC1352R , CC2640 , CC2640R2F , CC2640R2F-Q1 , CC2642R , CC2642R-Q1 , CC2650 , CC2650MODA , CC2652P , CC2652R , CC2652R7 , CC2652RB , CC2652RSIP
7 EnergyTrace
EnergyTrace is available on all CC13x2 and CC26x2 LaunchPads. The tool can be used stand-alone, as a power profiling tool, or in EnergyTrace++ mode (4-pin JTAG required) within a debug session for state monitoring to help optimize the application for ultra-low-power consumption. This section focuses on the steps necessary to run EnergyTrace in stand-alone-mode in CCS. In this mode, the debugger is not active and the displayed current consumption is what to expect for the final application. Since the previous sections have focused on Bluetooth Low Energy, this section will use one of the proprietary examples to show how to use EnergyTrace. Please note that the CC13x2 Proprietary RF User’s Guide [26] has a section with info regarding EnergyTrace.
The rfPacketTx example (available for our CC13x2 devices) was used running on the CC1352R1 LaunchPad [20].
The example can be found and downloaded using Resource Explorer (see Figure 7-1).
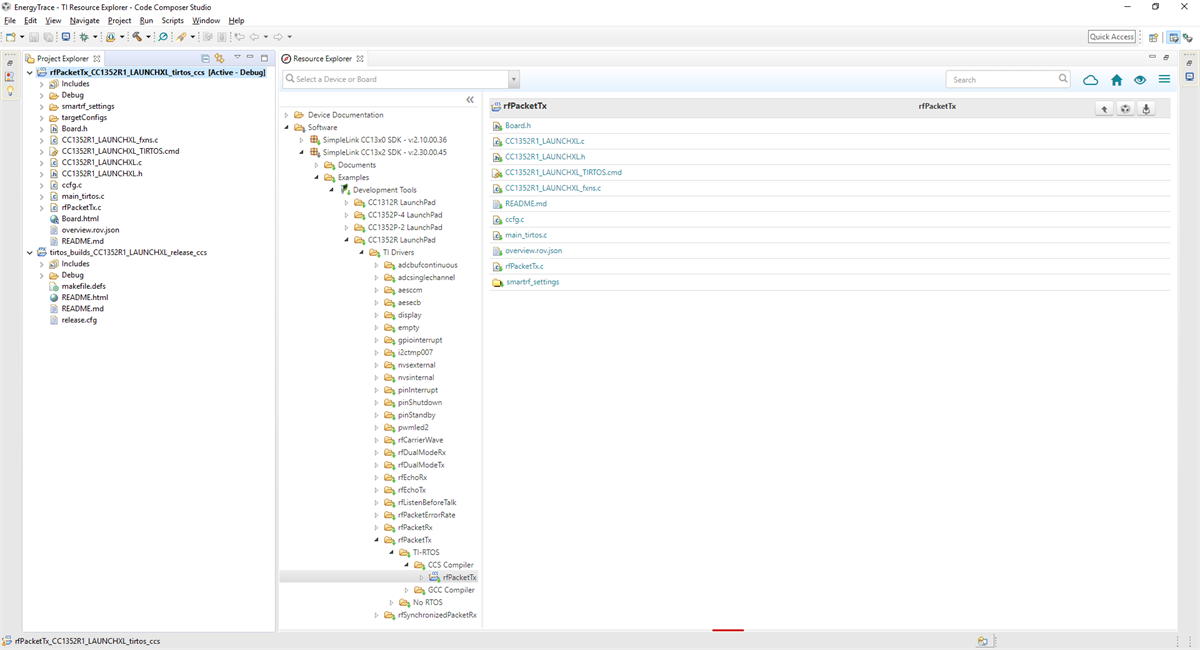 Figure 7-1 rfPacketTx in Resource
Explorer
Figure 7-1 rfPacketTx in Resource
ExplorerAfter building the example, it should be downloaded to the LaunchPad and the following steps should be done:
- Remove all jumpers on the LaunchPad between the XDS debugger
and the device, except for the XDS110 Power, the 3V3 and RXD jumpers (see Figure 7-2). It is important that the XDS110 jumper is mounted in the "XDS110 Power"
position when the LaunchPad is powered up, otherwise the calibration of
EnergyTrace will fail. The UART driver in the SDK configures the UART RX pin
without internal pull-up. To avoid current leakage in the input buffer, the pin
must always be firmly pulled to a logic level. This can be achieved by keeping
the RXD jumper on (connecting the debugger output to the UART RXD input).
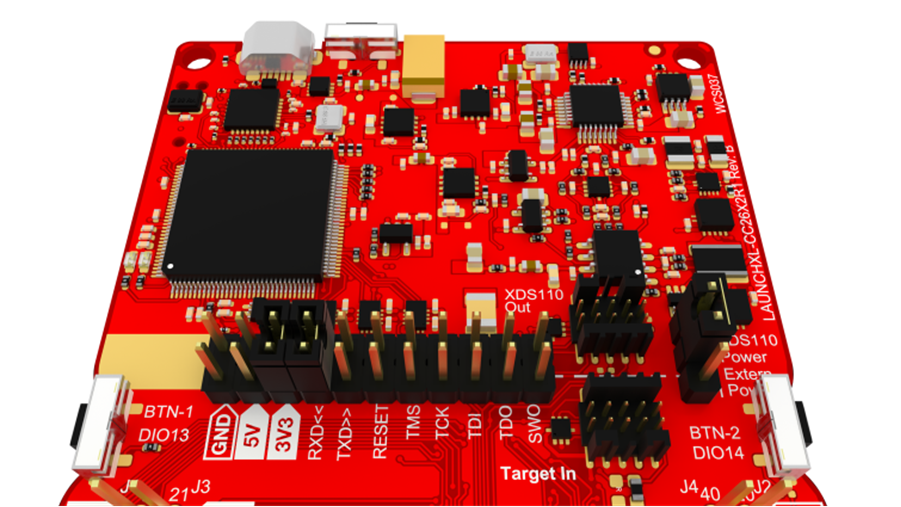 Figure 7-2 Jumper
Settings
 - If the jumpers were not set correctly BEFORE powering the board, trigger a re-calibration of EnergyTrace by power cycling the LaunchPad (disconnect and re-connect the micro-USB cable).
- EnergyTrace requires some configurations the first time it is
being used within a CCS workspace. Go to the menu `Window` and select
`Preferences` (see Figure 7-3).
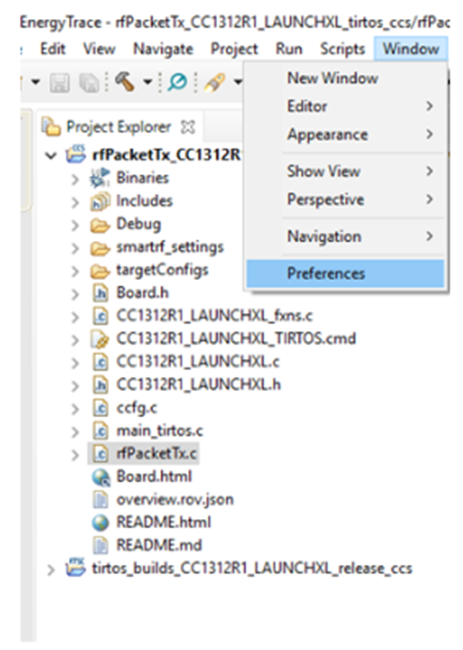 Figure 7-3 Preferences
 - Navigate to the `EnergyTrace
Technology` window and configure it as shown in Figure 7-4.
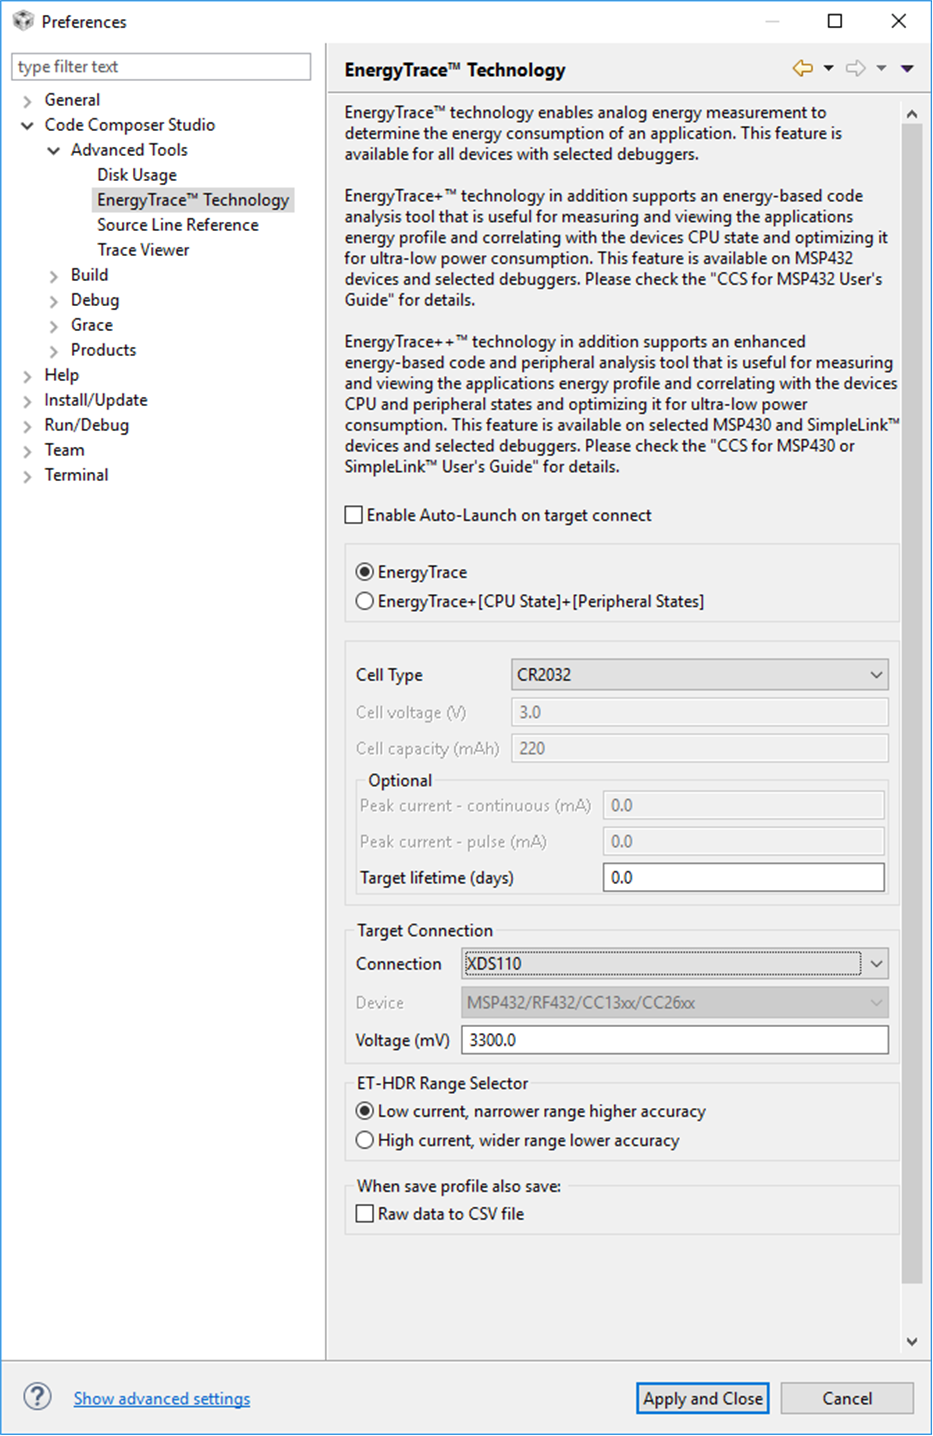 Figure 7-4 EnergyTrace Technology
Configuration
Figure 7-4 EnergyTrace Technology
ConfigurationIf post-processing of the acquired data is wanted, select the ‘Raw data to CSV file’ checkbox. If this checkbox is selected, you can, after EnergyTrace is finished capturing data, select the 'Save current energy profile' button, to save a .csv file. The default location for this file will be under your project workspace.
- Click the EnergyTrace Button (see
Figure 7-5).
 Figure 7-5 EnergyTrace
Button
Figure 7-5 EnergyTrace
ButtonA dialog with instructions on how to use the EnergyTrace Stand-alone Measurement Mode will pop-up. Click ‘Proceed’ to continue.
- Select how long you want to capture data by clicking the ‘Set
Measurement Duration’ button (see Figure 7-6).
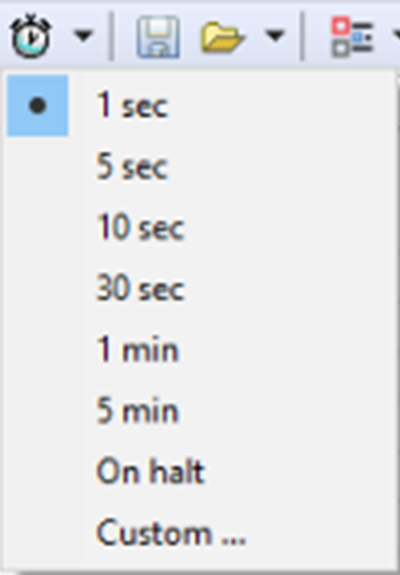 Figure 7-6 Set Measurement
Duration
 - Click the green play button to start
capturing data (see Figure 7-7). The red LED on the XDS110 debugger should be turned on, and will be so for
the duration of the EnergyTrace capture.
 Figure 7-7 Start Trace
Collection
 - When EnergyTrace is finished capturing data, review the
application’s power profile and have a closer look at the current graph
 .
.
Figure 7-8 shows the current profile for the rfPacketTX example taken over 1 s. From the plot, it is easy to identify the packet interval of 500 ms and to verify that the device enters Standby in-between packets. If you want to zoom in on the current graph, you can use the magnifying glass symbol.
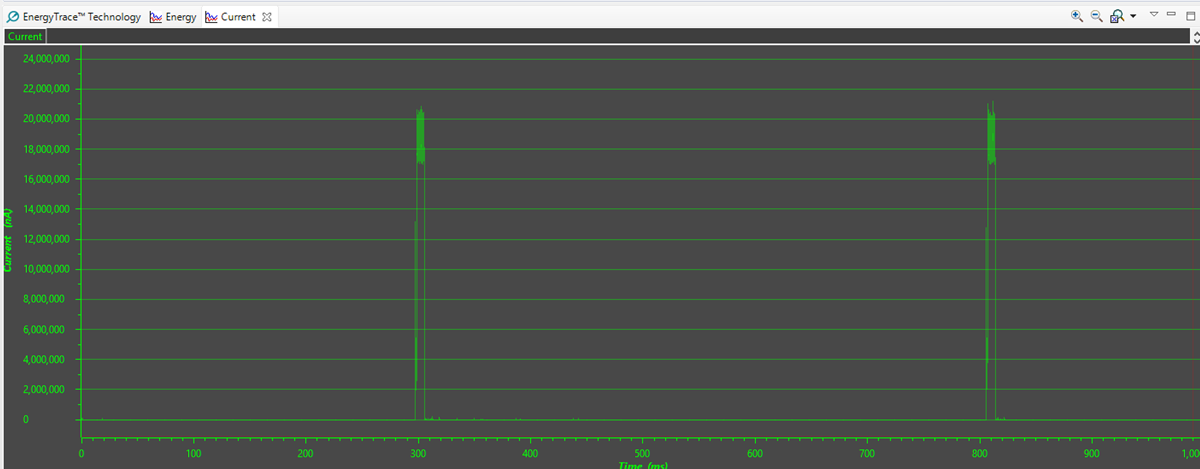 Figure 7-8 Current Profile for rfPacketTx
(without modifications)