TIDT234 November   2022


  1.   Description
  2.   Features
  3.   Applications
  4. 1Test Prerequisites
    1. 1.1 Voltage and Current Requirements
    2. 1.2 Required Equipment
    3. 1.3 Considerations
    4. 1.4 Dimensions
  5. 2Testing and Results
    1. 2.1 Efficiency and Power Loss Graphs
    2. 2.2 Efficiency Data
    3. 2.3 Thermal Images
  6. 3Waveforms
    1. 3.1 Switching
    2. 3.2 Output Voltage Ripple
    3. 3.3 Load Transients
    4. 3.4 Start-up Sequence
    5. 3.5 Conducted EMI Performance

Load Transients

The following set of figures show the load transient response between PFM and FPWM modes at 30-V input. The load is stepped from 50% to 100% of the load, corresponding to a 0.5 A to 1 A step.
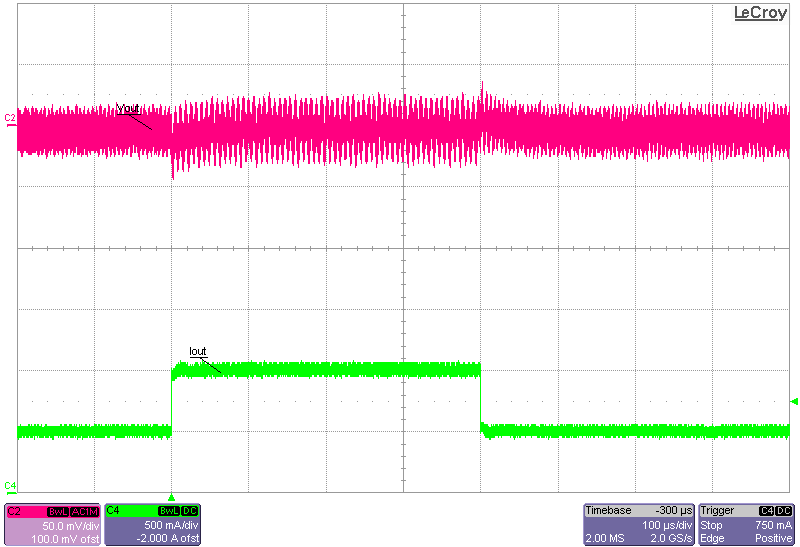
Note: See the Note in the Considerations section.
GUID-20210309-CA0I-MPRM-PL8Z-M0TLKZ4J0Z7V-low.pngFigure 3-13 Load Transient Response, PFM-Mode
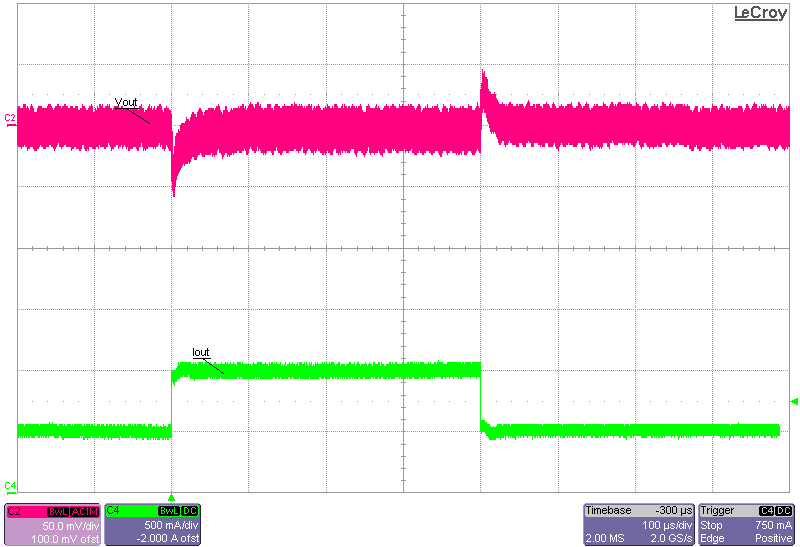
GUID-20210309-CA0I-SLC3-QTK9-DP3SHJJ0Z8TP-low.pngFigure 3-14 Load Transient Response, FPWM-Mode