TIDT242 November 2022
2.5 Bode Plots
The TPS25772-Q1 bode plots are shown in Figure 2-18 through Figure 2-21.
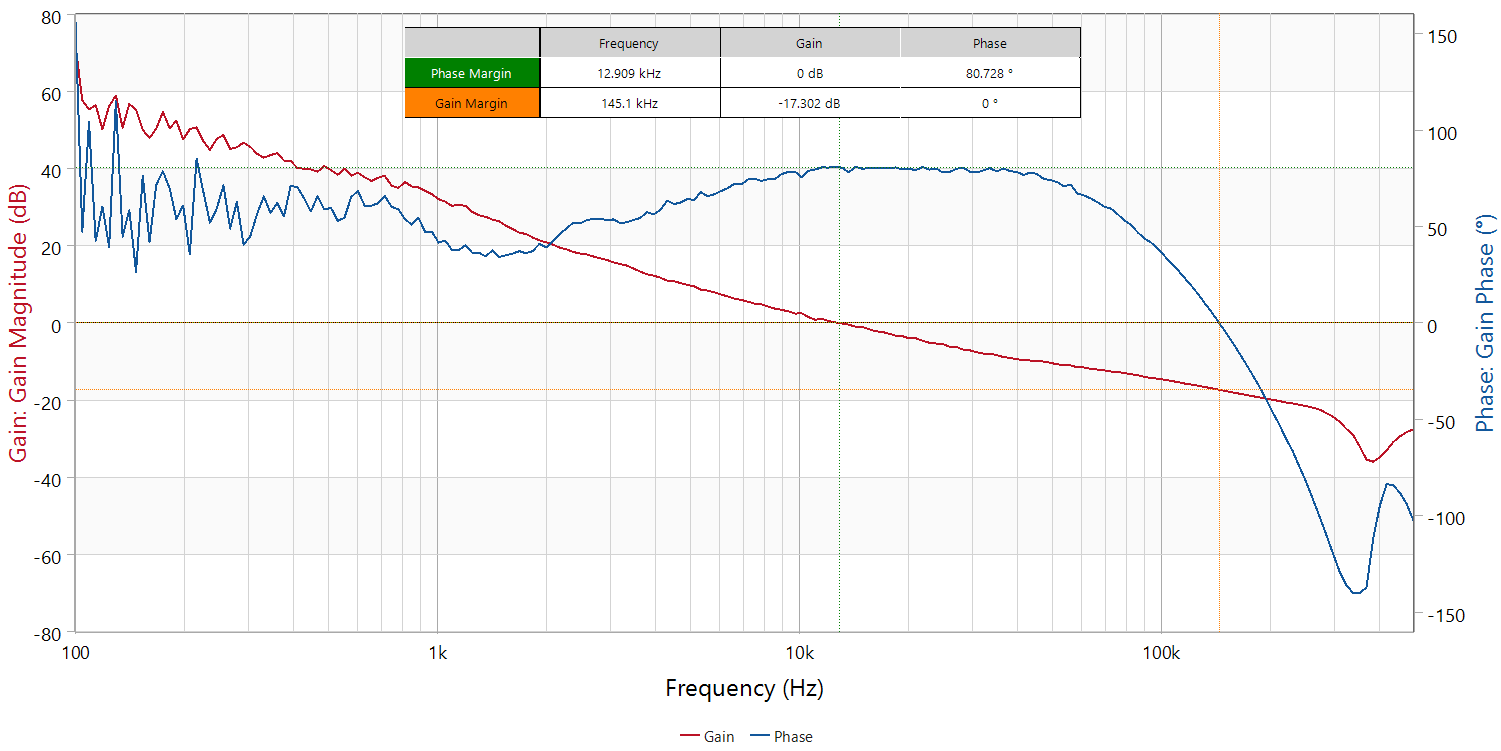 Figure 2-18 TPS25772-Q1 13.5
VIN, 5 VOUT Bode Plots
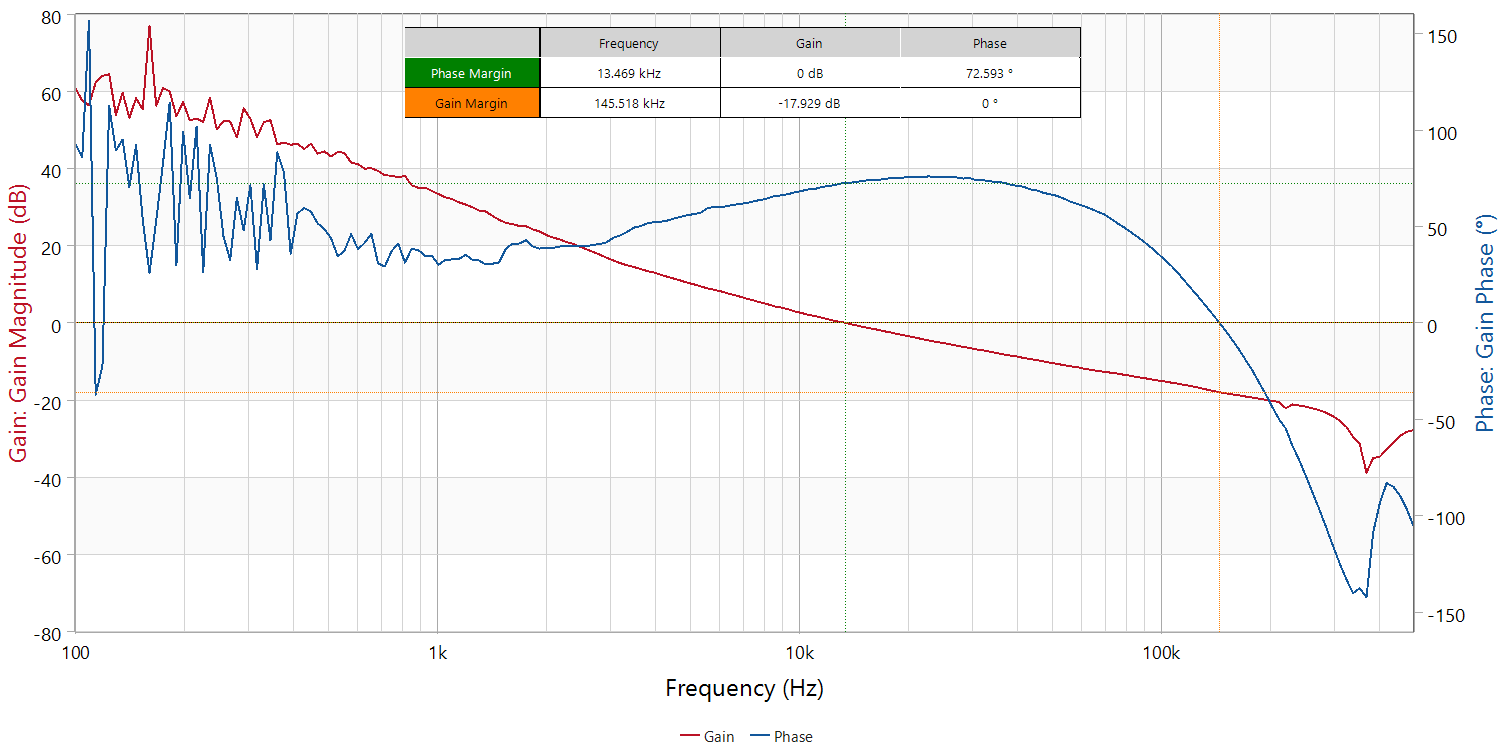 Figure 2-19 TPS25772-Q1 13.5
VIN, 9 VOUT Bode Plots
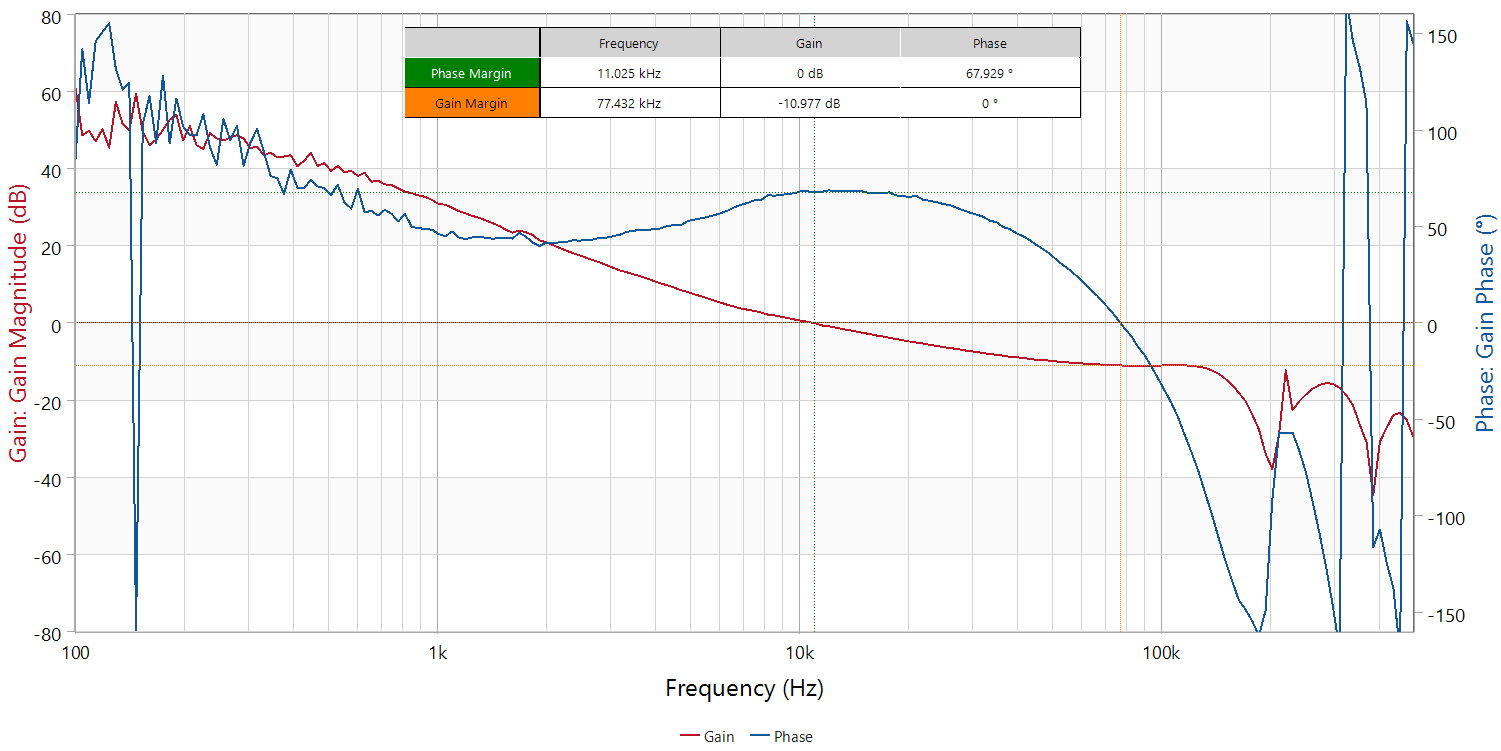 Figure 2-20 TPS25772-Q1 13.5
VIN, 15 VOUTBode Plots
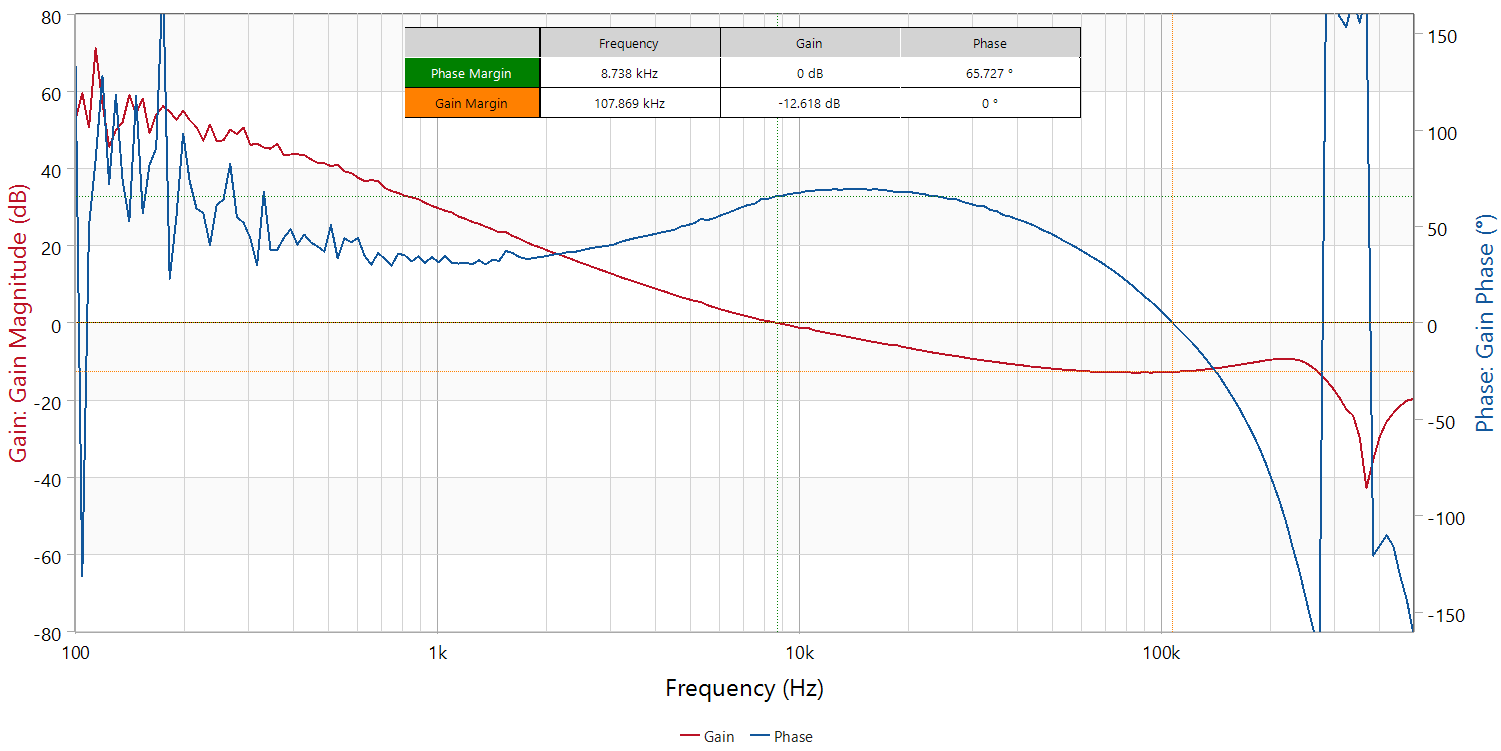 Figure 2-21 TPS25772-Q1 13.5
VIN, 20 VOUT Bode Plots
Figure 2-21 TPS25772-Q1 13.5
VIN, 20 VOUT Bode PlotsTable 2-3 shows the TPS25772-Q1 phase margin and gain margin.
Table 2-3 TPS25772-Q1 Phase Margin and Gain Margin
| VIN (V) | VOUT (V) | Phase Margin (°) | Gain Margin (dB) |
|---|---|---|---|
|
13.5 |
5 |
80.728 |
–17.302 |
|
13.5 |
9 |
72.593 |
–17.929 |
|
13.5 |
15 |
67.929 |
–10.977 |
|
13.5 |
20 |
65.727 |
–12.618 |
The TPS55288-Q1 bode plots are shown in Figure 2-22 through Figure 2-25.
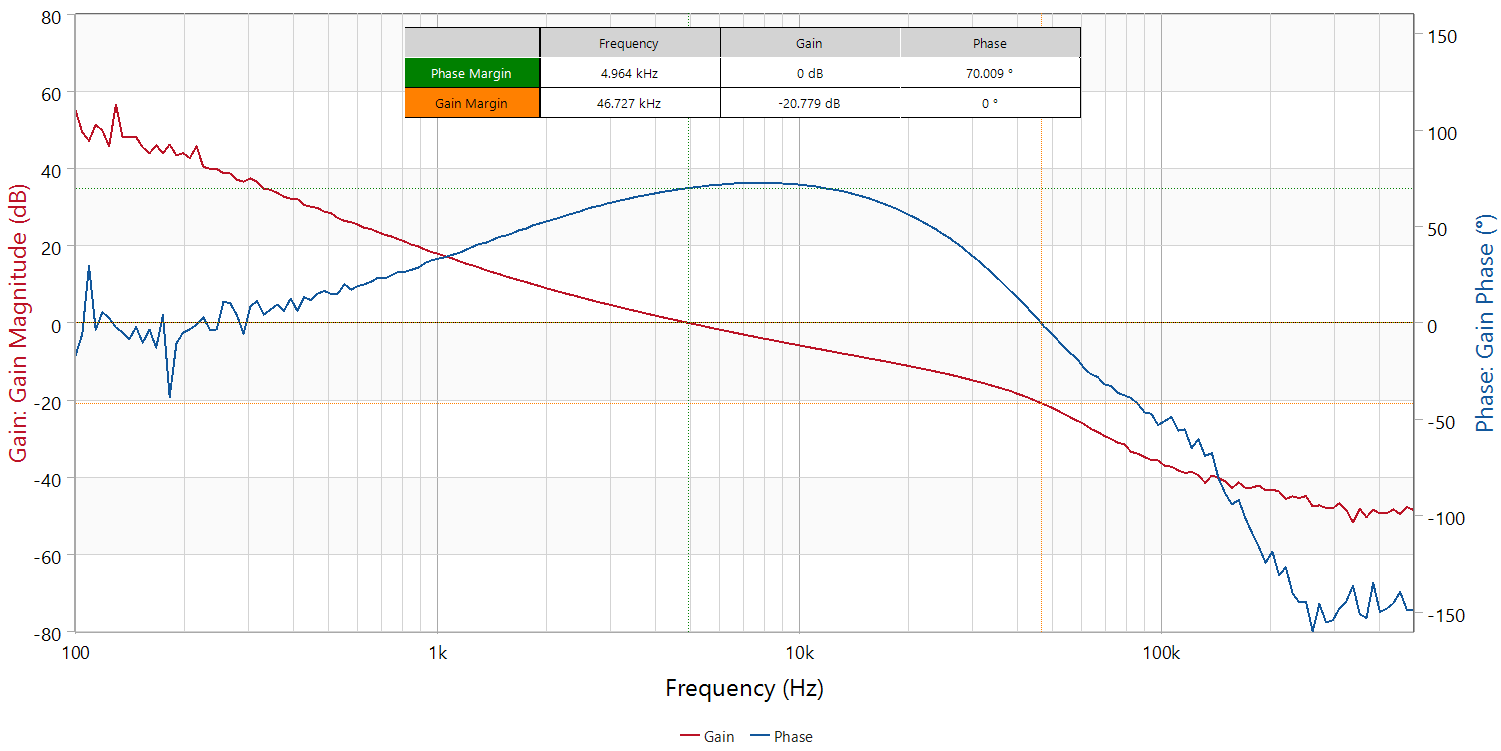 Figure 2-22 TPS55288-Q1 13.5
VIN, 5 VOUT Bode Plots
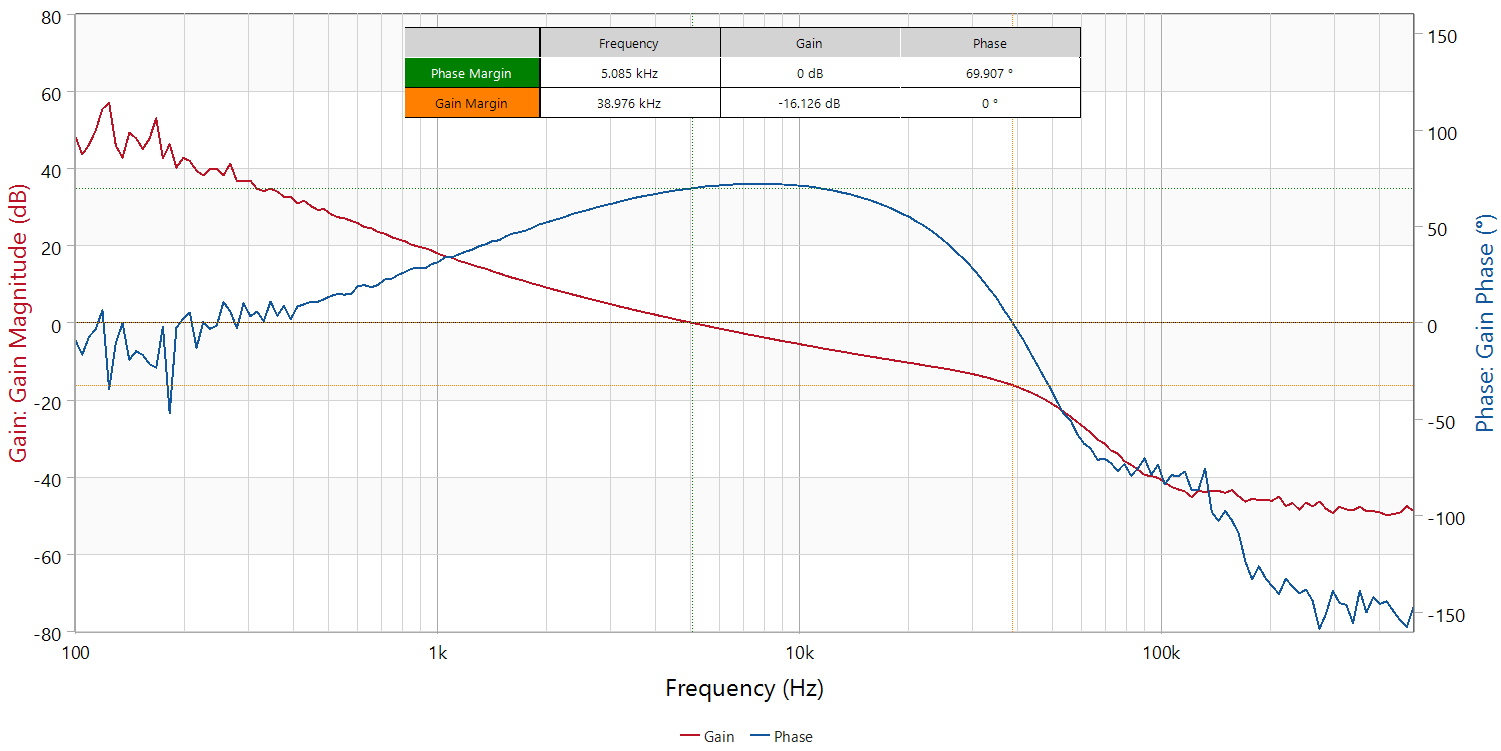 Figure 2-23 TPS55288-Q1 13.5
VIN, 9 VOUT Bode Plots
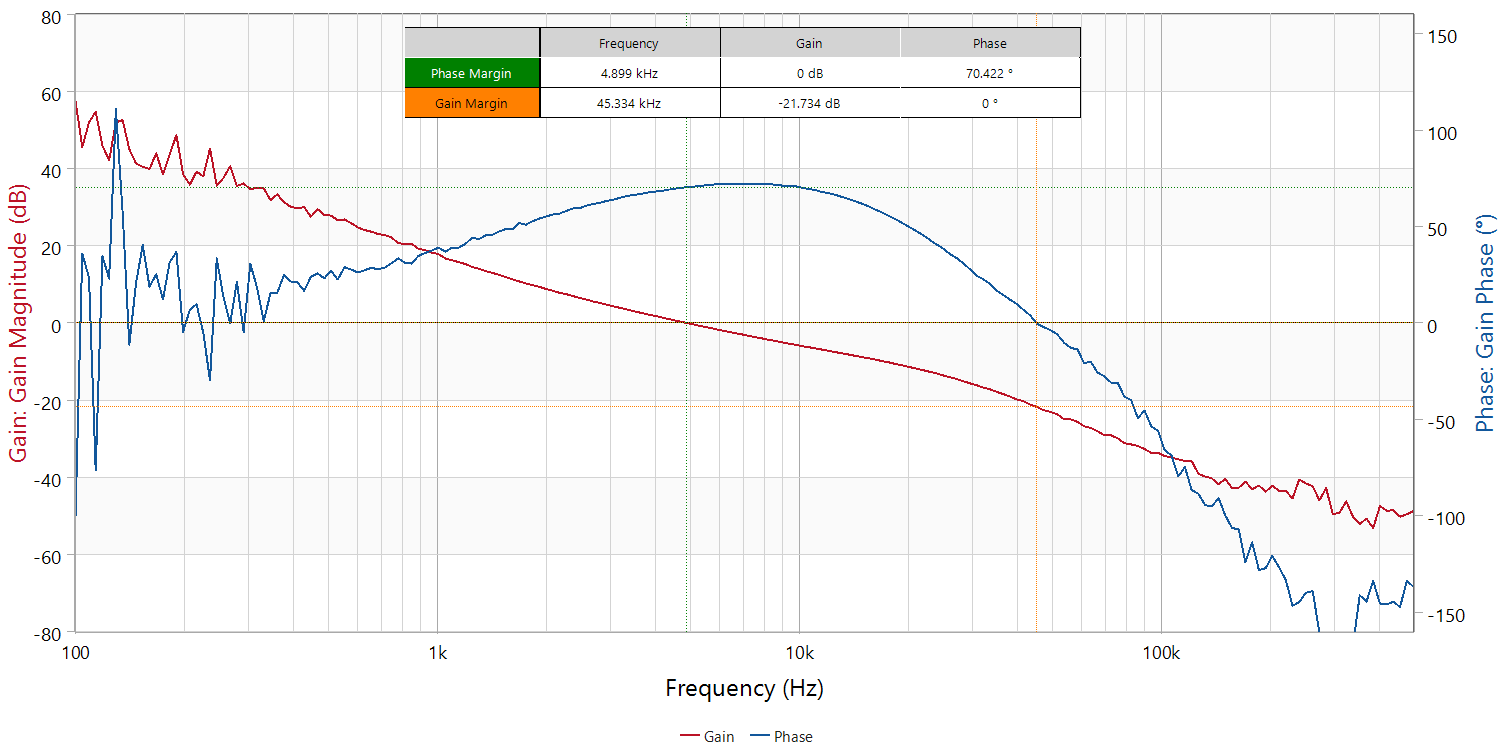 Figure 2-24 TPS55288-Q1 13.5
VIN, 15 VOUT Bode Plots
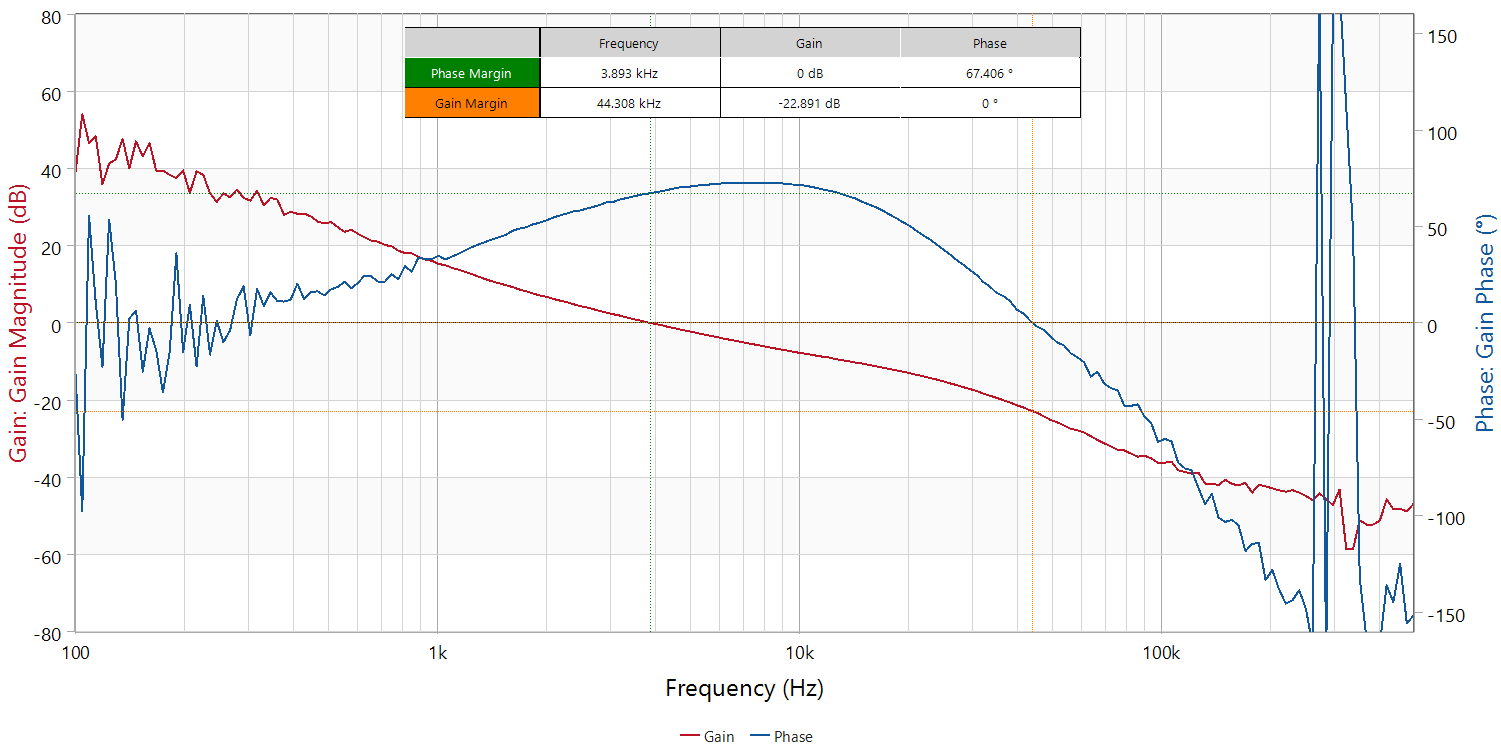 Figure 2-25 TPS55288-Q1 13.5
VIN, 20 VOUT Bode Plots
Figure 2-25 TPS55288-Q1 13.5
VIN, 20 VOUT Bode PlotsTable 2-4 shows the TPS55288-Q1 phase margin and gain margin.
Table 2-4 TPS55288-Q1 Phase Margin and Gain Margin
| VIN (V) | VOUT (V) | Phase Margin (°) | Gain Margin (dB) |
|---|---|---|---|
|
13.5 |
5 |
70.009 |
–20.779 |
|
13.5 |
9 |
69.907 |
–16.126 |
|
13.5 |
15 |
70.422 |
–21.734 |
|
13.5 |
20 |
67.406 |
–22.891 |