TIDT249 September 2021
3.1 Efficiency
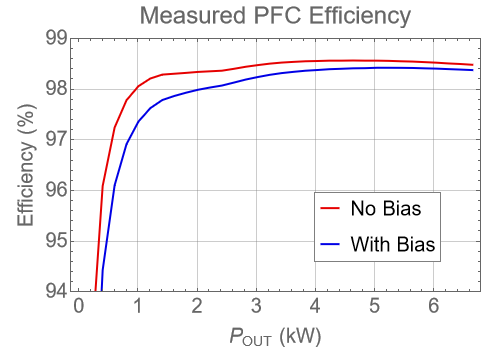
Efficiency data is provided in the following graphs with and without 12-V bias power. The bias supplies power to control, isolators, and gate drive. The graph in Figure 3-1 was taken under the following conditions:
- VIN,RMS = 240 V
- VOUT = 400 V
- Coolant Temperature: 20°C
 Figure 3-1 PFC Efficiency
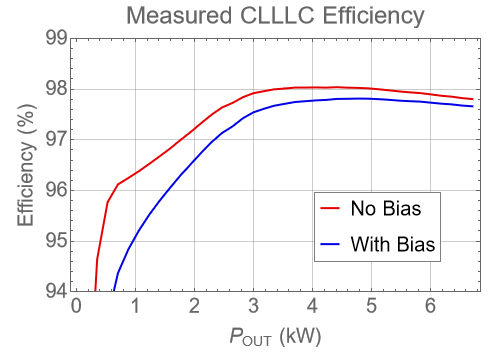
The graph in Figure 3-2 was taken under the following conditions:
- VIN = 400 V
- VOUT = 350 V
- Coolant Temperature: 20°C
 Figure 3-2 CLLLC Efficiency
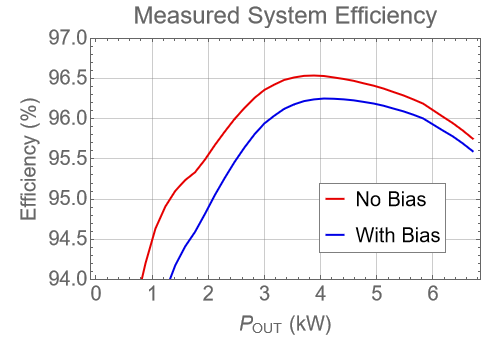
The graph in Figure 3-3 was taken under the following conditions:
- VIN,RMS = 240 V
- VOUT = 350 V
- Coolant Temperature: 20 °C
 Figure 3-3 System Efficiency