TIDT256A March 2022 – March 2022
3.6 Isolated Gate Drive
Isolated gate drive waveforms are shown in this section.

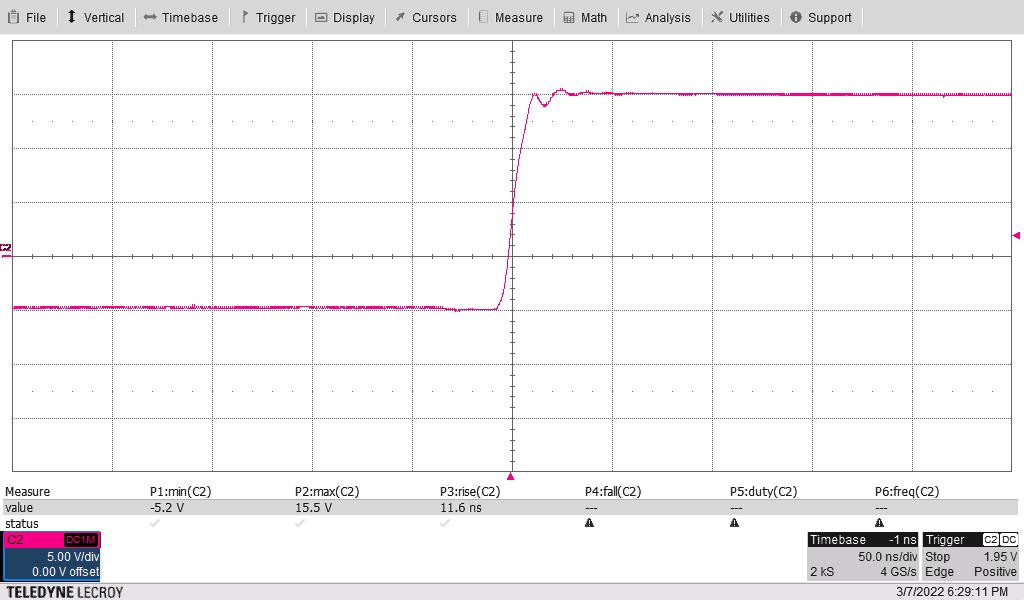
+15 V, –5 V to isolated driver,
model t16 used
Scope at full 500-MHz bandwidth
Scope channel two red showing gate voltage versus isolated side ground
Scope at full 500-MHz bandwidth
Scope channel two red showing gate voltage versus isolated side ground
Rising (10% to 90%) in 12
ns
Figure 3-17 Rising Waveform - No
Load
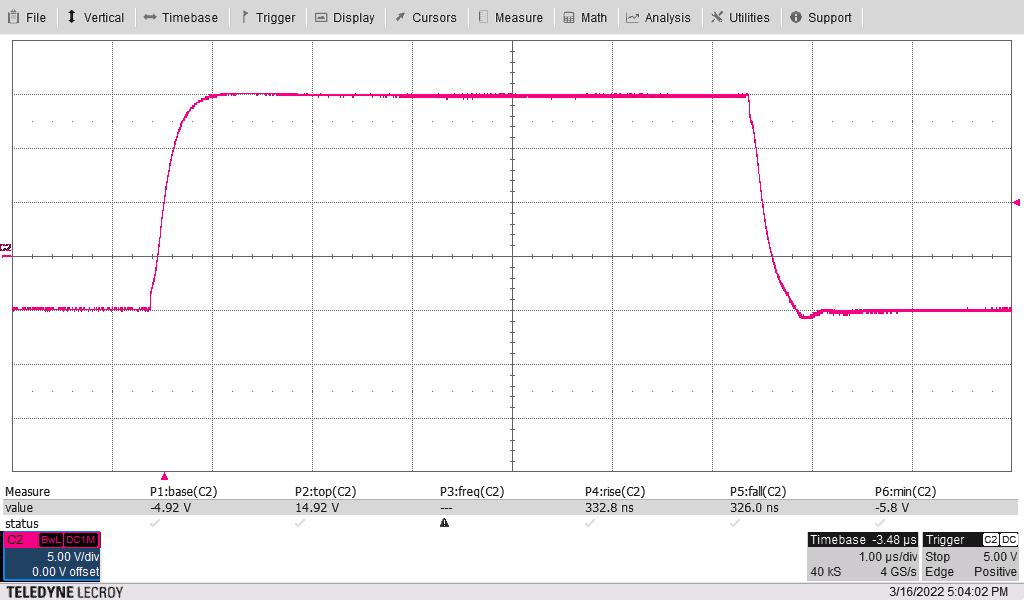
+15 V, –5 V to isolated driver,
model t11 used
Scope at 200-MHz bandwidth
Scope channel two red showing gate voltage versus isolated side ground
Scope at 200-MHz bandwidth
Scope channel two red showing gate voltage versus isolated side ground
Rising (10% to 90%) in 333 ns
and falling (90% to 10%) in 326 ns
Figure 3-19 Gate Loaded With 100 nF,
2-μC Charge: One 6-μs Pulse
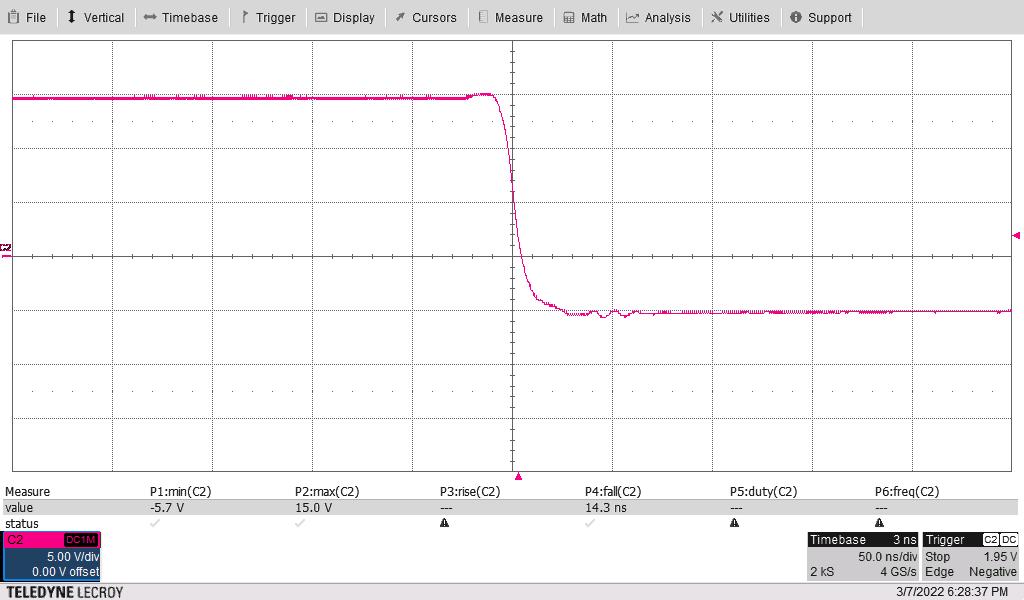
+15 V, –5 V to isolated driver,
model t16 used
Scope at full 500-MHz bandwidth
Scope channel two red showing gate voltage versus isolated side ground
Scope at full 500-MHz bandwidth
Scope channel two red showing gate voltage versus isolated side ground
Falling (90% to 10%) in 14
ns
Figure 3-18 Falling Waveform - No
Load
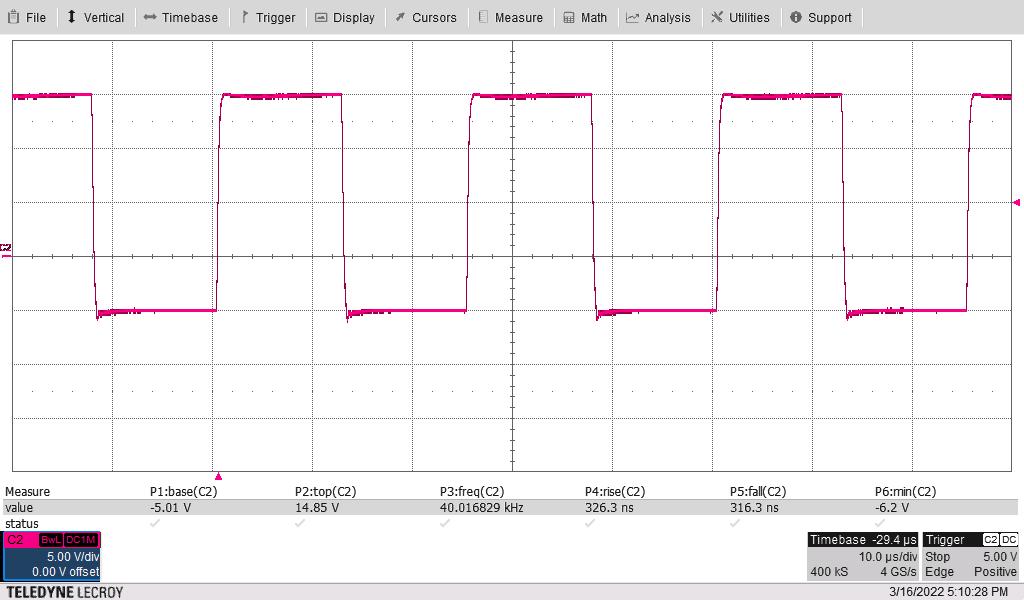
+15 V, –5 V to isolated driver,
model t11 used
Scope at 200-MHz bandwidth
Scope channel two red showing gate voltage versus isolated side ground
Figure 3-20 Gate Loaded With 100 nF,
2-μC Charge: 40 kHz, 50% Duty, 4 CyclesScope at 200-MHz bandwidth
Scope channel two red showing gate voltage versus isolated side ground