TIDT292 June   2022


  1.   Description
  2.   Features
  3.   Applications
  4. 1Test Prerequisites
    1. 1.1 Voltage and Current Requirements
    2. 1.2 Required Equipment
    3. 1.3 Dimensions
    4. 1.4 Test Setup
  5. 2Testing and Results
    1. 2.1 Efficiency Graphs
    2. 2.2 Efficiency Data
    3. 2.3 Power Factor and iTHD Versus Load, VAC and Frequency
      1. 2.3.1 Power Factor and iTHD Tables
    4. 2.4 Thermal Image
    5. 2.5 Bode Plots
    6. 2.6 Input AC Current Measurements: Compliance to DO160 Harmonic Limits
  6. 3Waveforms
    1. 3.1 Switching
    2. 3.2 Output Voltage Ripple
    3. 3.3 AC Waveforms (Input Voltage and Current, PFC Output Voltage)
    4. 3.4 Load Transients
    5. 3.5 Inrush Current
    6. 3.6 Start-Up Sequence
    7. 3.7 Shutdown

Start-Up Sequence

After the VCC capacitor C60 is charged, the converter starts up, supplying the LLC and PFC stage. Here VIN was 115 VAC and the frequency was 400 Hz. The screenshots in Figure 3-16 through Figure 3-18 were taken, in no-load condition, 8-A and 13-A load.
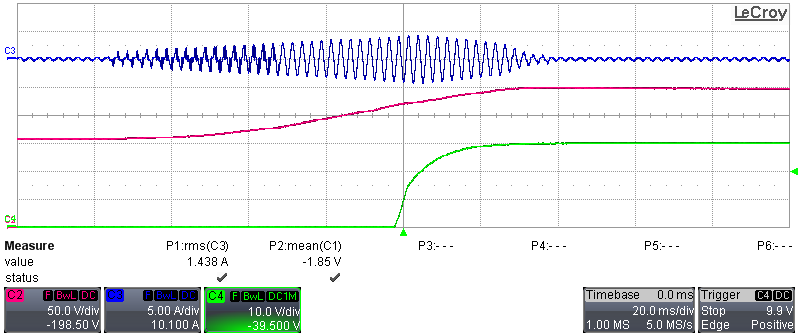
GUID-20220527-SS0I-LJG6-K0BX-KHSPM4X4BZNP-low.pngFigure 3-16 No Load (C2: VPFC, C4: VOUT, C3: IIN)
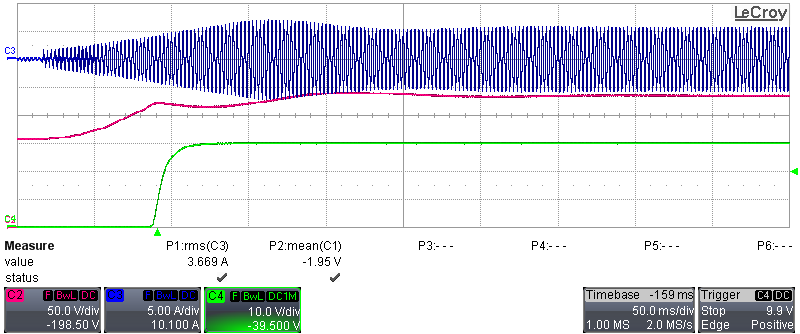
GUID-20220527-SS0I-7QMK-FM48-M5ZJ8G9XXQSB-low.pngFigure 3-18 13-A Load (C2: VPFC, C4: VOUT, C3: IIN)
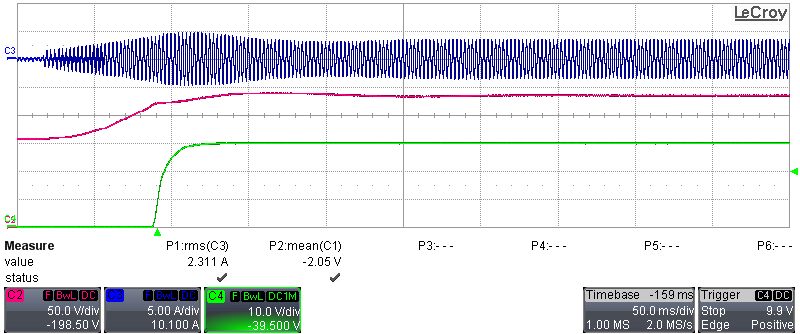
GUID-20220527-SS0I-ZSDQ-5CW5-QVNFWK82LZ77-low.pngFigure 3-17 8-A Load (C2: VPFC, C4: VOUT, C3: IIN)