TIDT318 January 2023
2.3 Bode Plots
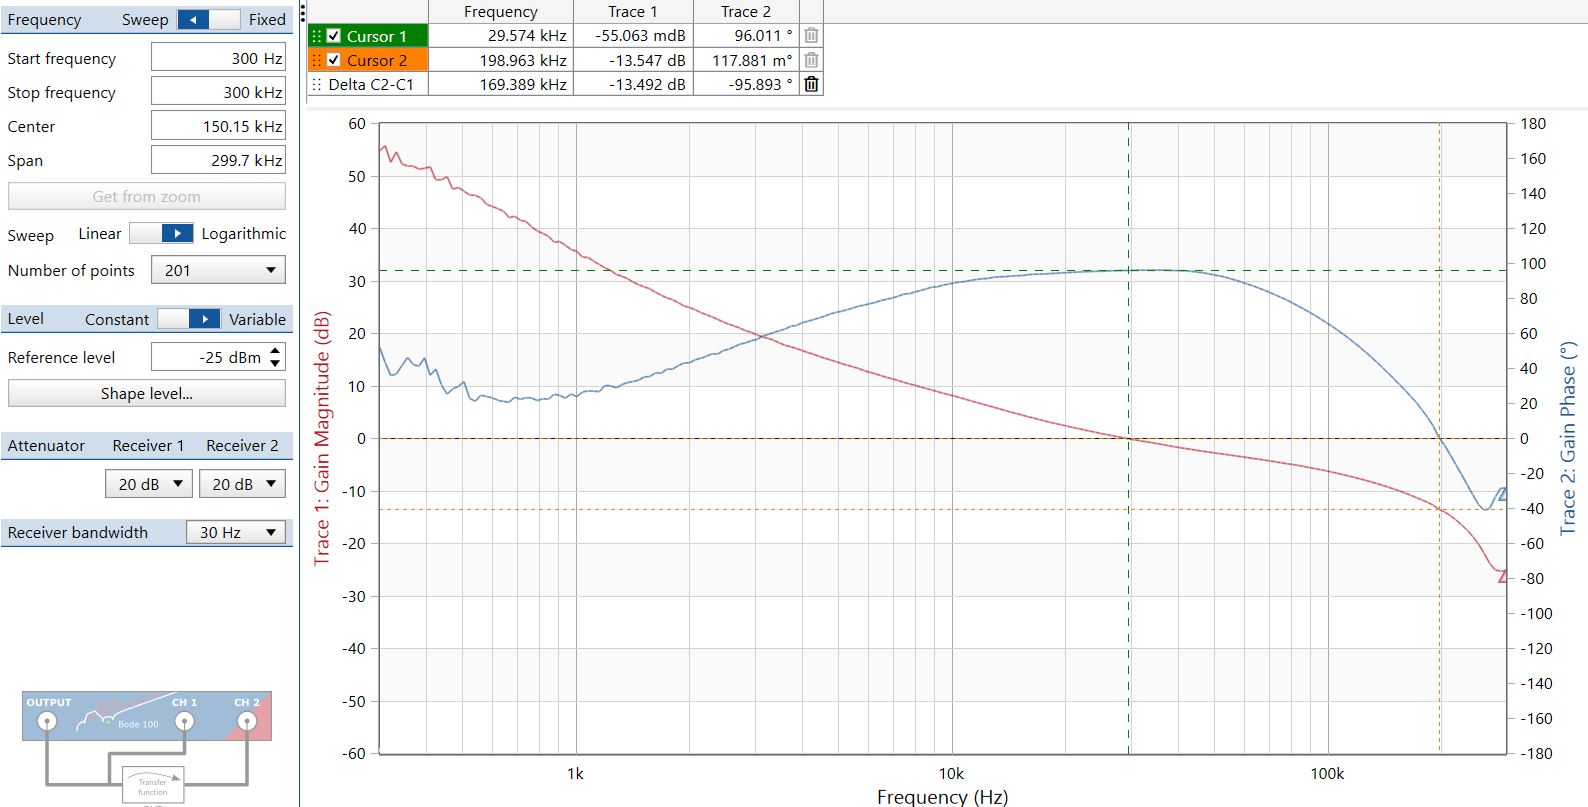
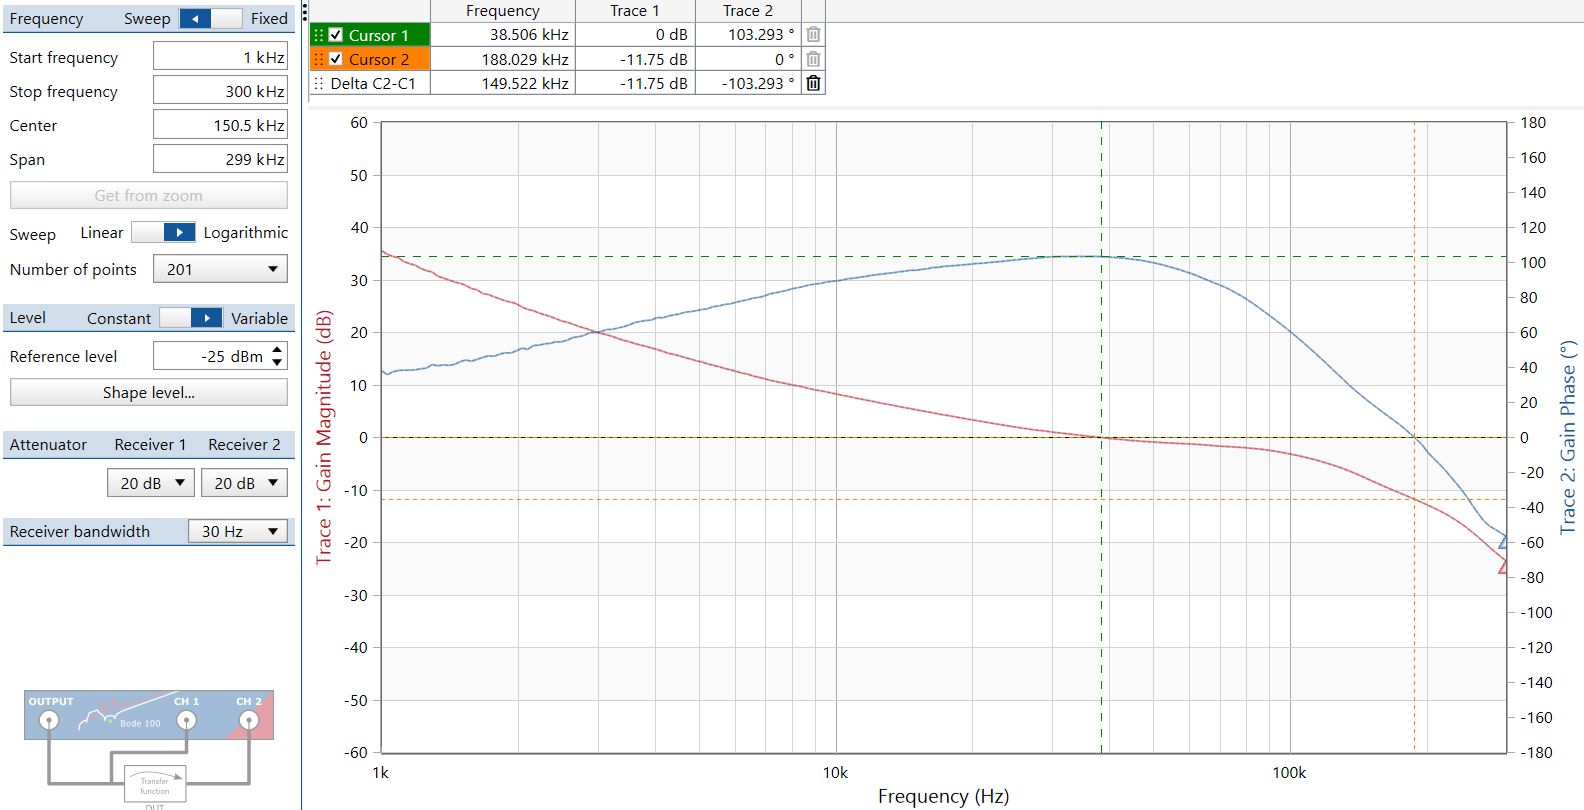
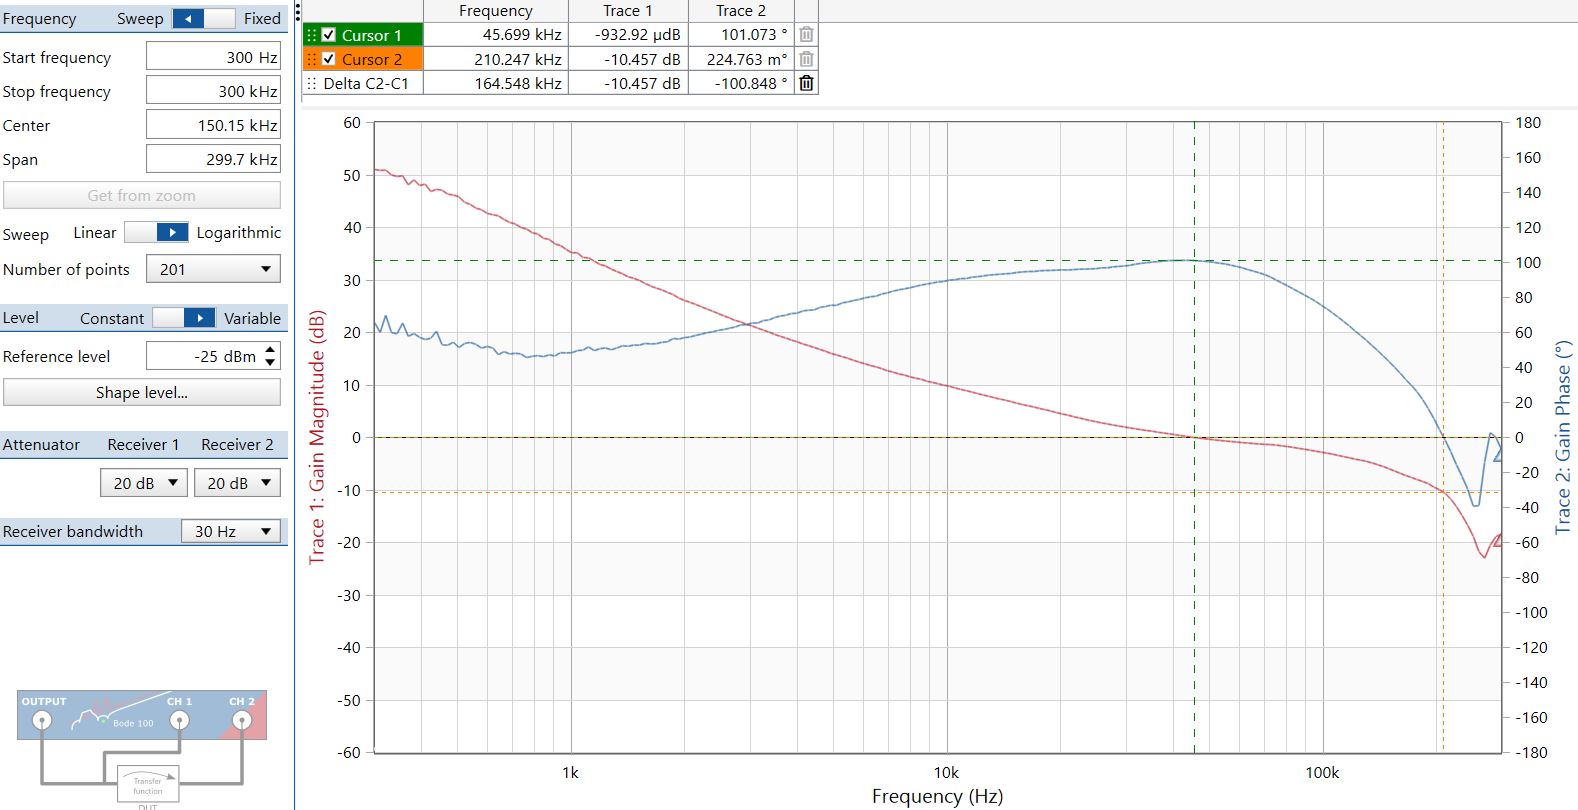
All three Bode plots in this section are shown at 14-V input at 3.3-V output.
Figure 2-7 shows the Bode plot at 0-A load. The Bode plot in Figure 2-8 is created at a 30-A load and the Bode plot in Figure 2-9 was created at the maximum 60-A load.
Crossover increases with load from 30 kHz at no load to 46 kHz at the maximum 60-A load, but phase margin is always at least 96 degrees and gain margin is more than 10 dB.
 Figure 2-7 Bode Plot, 0-A Load
 Figure 2-8 Bode Plot, 30-A Load
 Figure 2-9 Bode Plot at Maximum 60-A
Load