TIDT365 November 2023
3.2 Dead Time
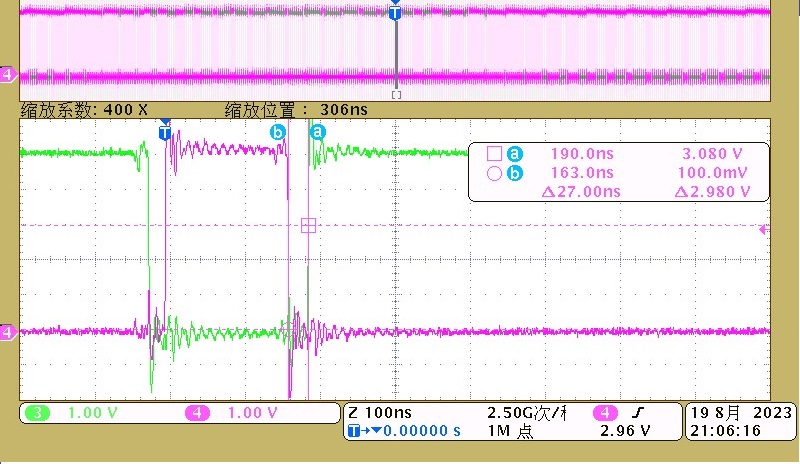
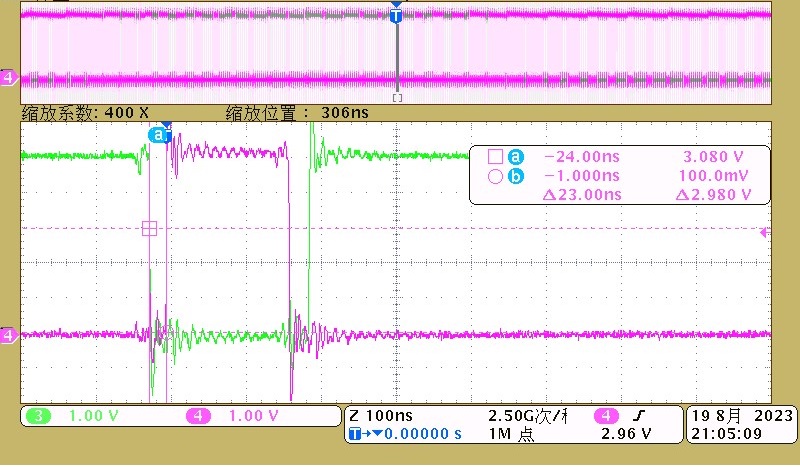
Dead time is shown in the following figures.
Dead time can be changed by adjusting the value of C13 and C18. Currently, C13 is 470 pF, C18 is 560 pF, making the dead time around 23 ns.
 Figure 3-4 Dead Time Between Falling Edge of LI (Pink)
and Rising Edge of HI (Green)
 Figure 3-5 Dead Time Between Rising Edge of LI (Pink) and
Falling Edge of HI (Green)