TIDT366 November 2023
3.3 Load Transients
The following images show the load transient waveforms, when performing open load to full load tests. The open load on time was set to 400 ms to make sure the time is sufficient for output voltage settle back to normal regulation voltage, and full load on time was set to 40 ms.
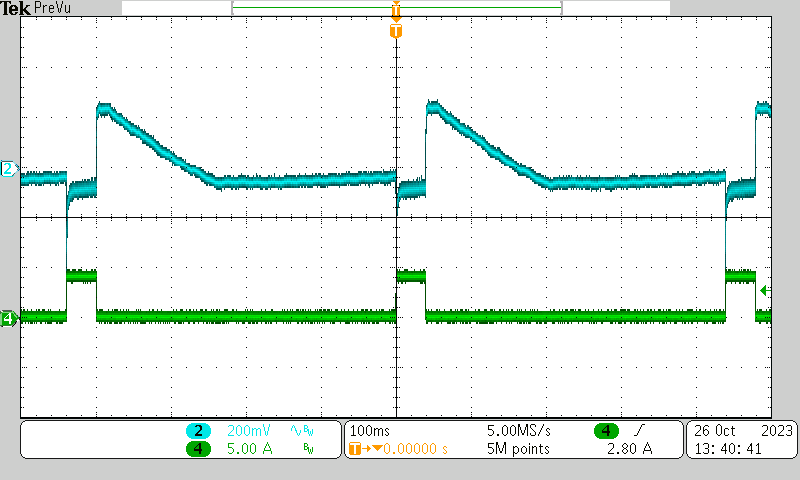 Figure 3-31 Open Load to 4-A Load
Dynamic at 300 VIN, VOUT (Blue), IOUT
(Green)
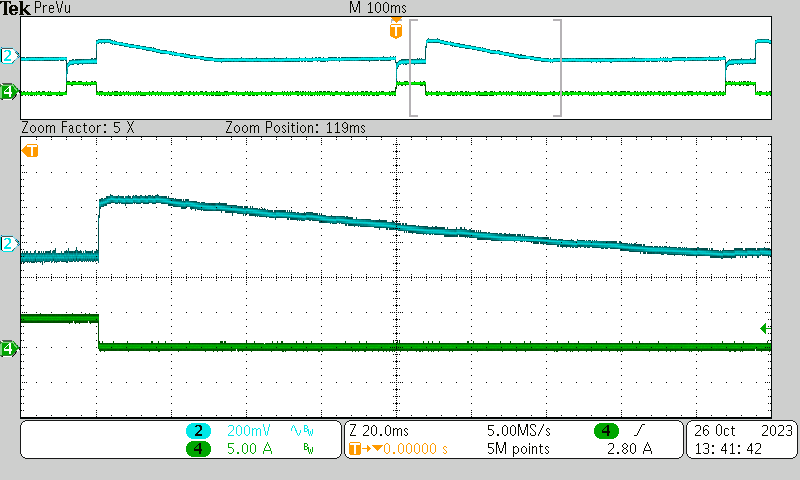 Figure 3-33 Open Load to 4-A Load
Dynamic at 300 VIN, Zoom of Overshoot VOUT (Blue),
IOUT (Green)
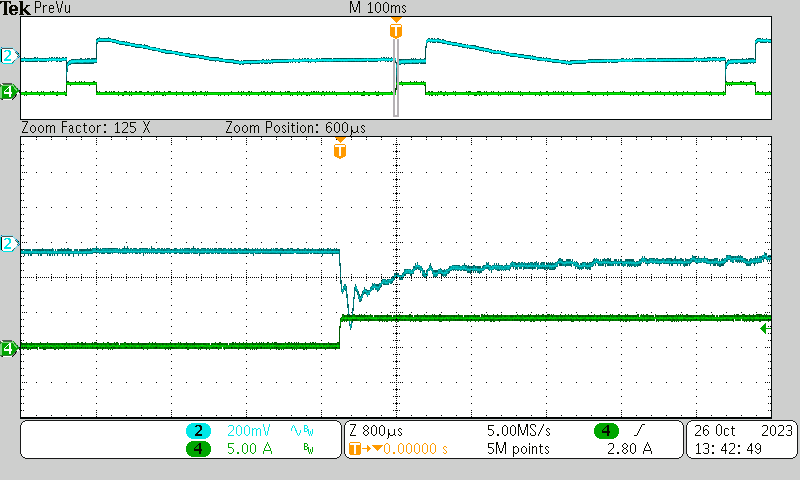 Figure 3-35 Open Load to 4-A Load
Dynamic at 600 VIN, Zoom of Undershoot VOUT (Blue),
IOUT (Green)
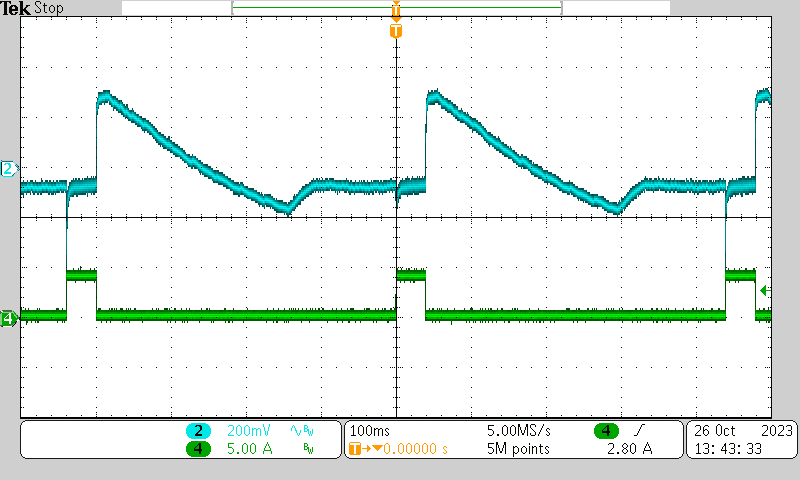 Figure 3-37 Open Load to 4-A Load
Dynamic at 1000 VIN, VOUT (Blue),
IOUT (Green)
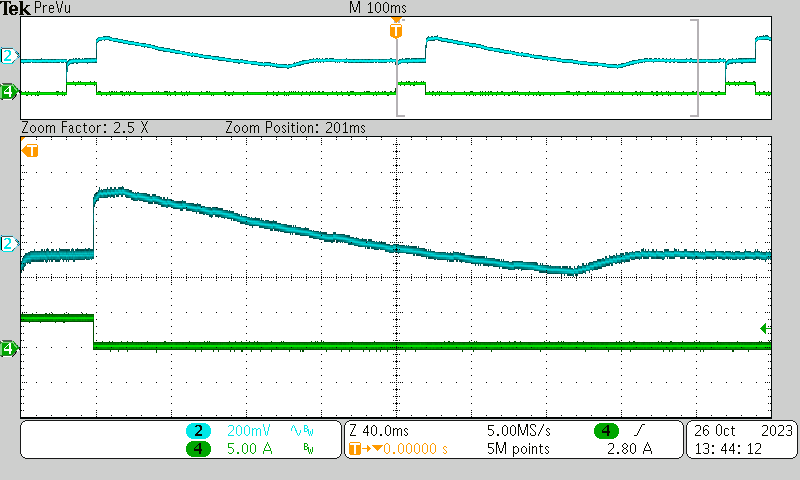 Figure 3-39 Open Load to 4-A Load
Dynamic at 1000 VIN, Zoom of Overshoot VOUT (Blue),
IOUT (Green)
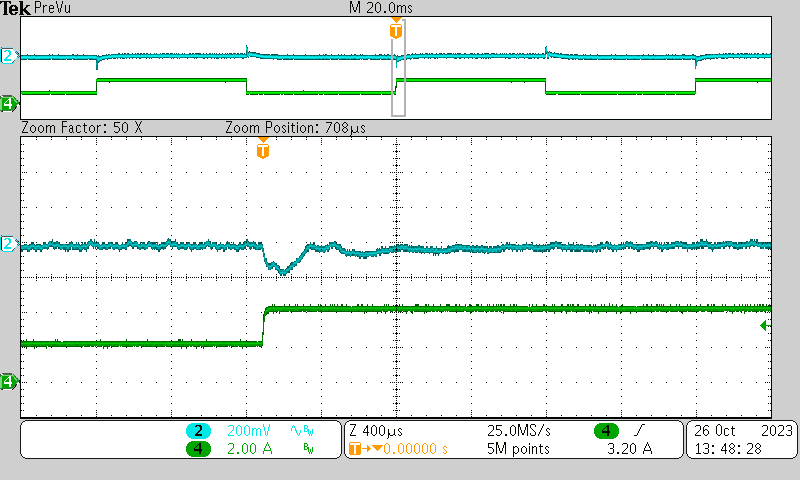 Figure 3-41 2-A to 4-A Load Dynamic at
1000 VIN, Zoom of Undershoot VOUT (Blue),
IOUT (Green)
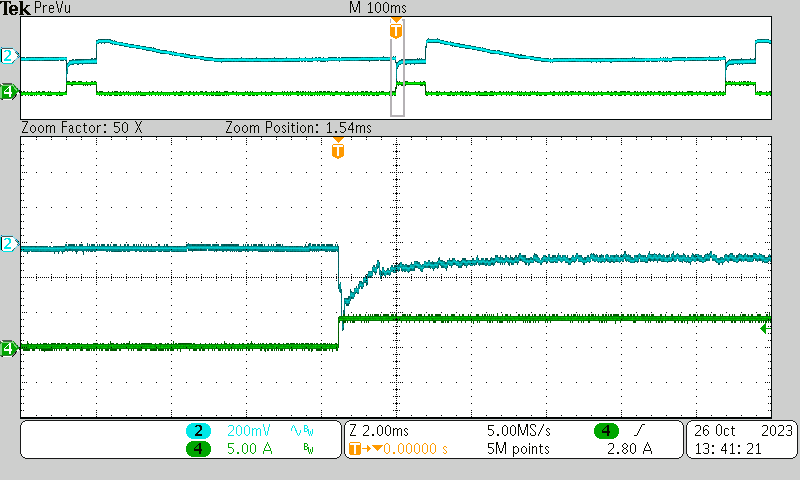 Figure 3-32 Open Load to 4-A Load
Dynamic at 300 VIN, Zoom of Undershoot VOUT (Blue),
IOUT (Green)
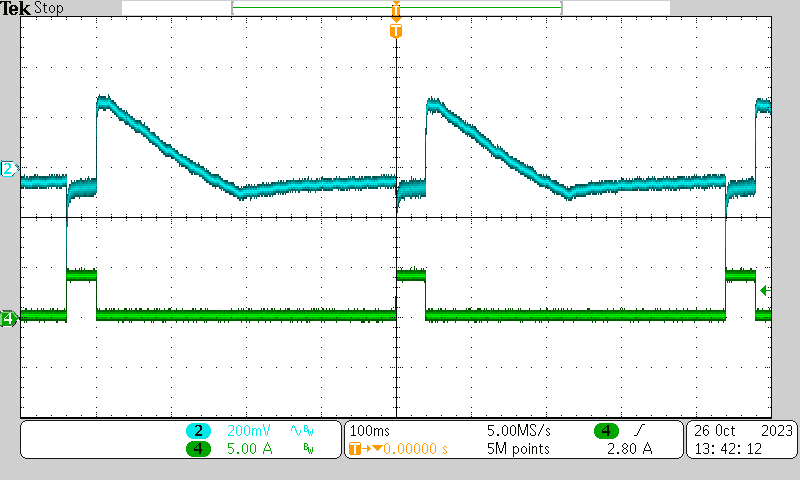 Figure 3-34 Open Load to 4-A Load
Dynamic at 600 VIN, VOUT (Blue),
IOUT (Green)
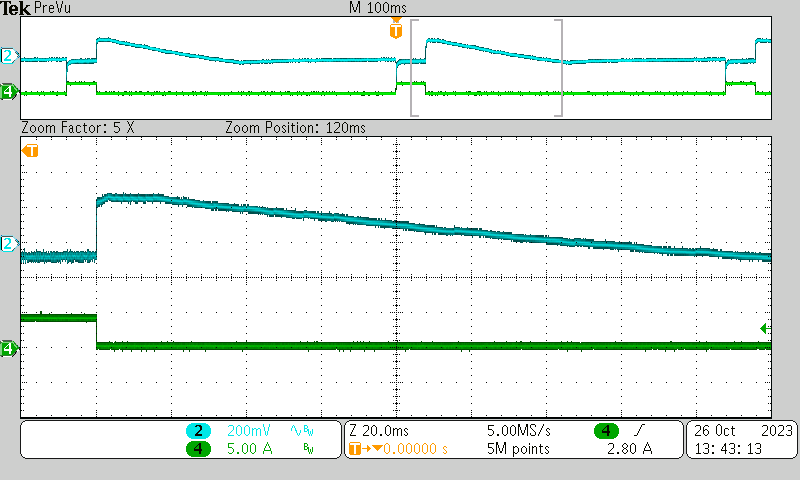 Figure 3-36 Open Load to 4-A Load
Dynamic at 600 VIN, Zoom of Overshoot VOUT (Blue),
IOUT (Green)
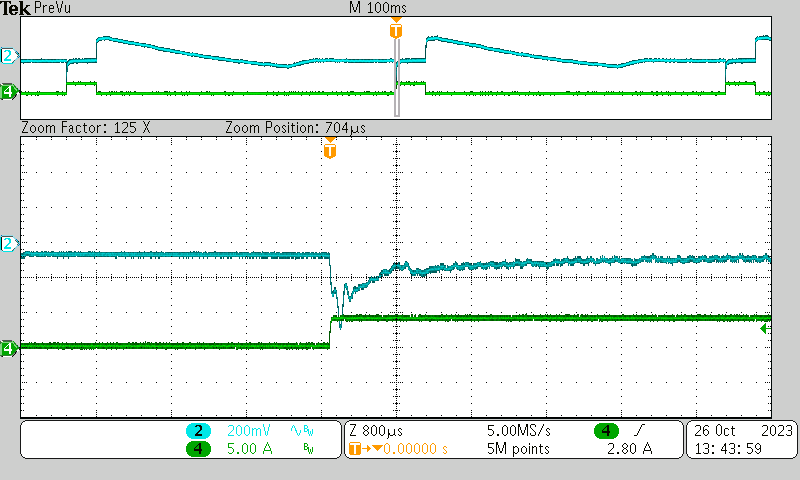 Figure 3-38 Open Load to 4-A Load
Dynamic at 1000 VIN, Zoom of Undershoot VOUT (Blue),
IOUT (Green)
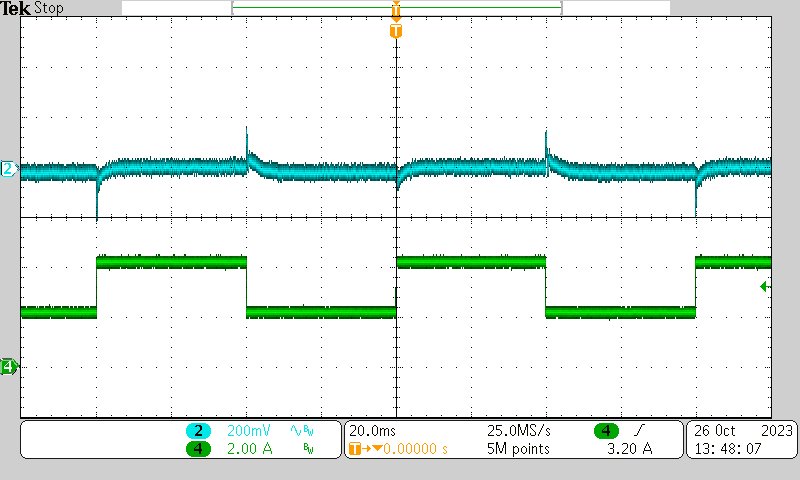 Figure 3-40 2-A to 4-A Load Dynamic at
1000 VIN, VOUT (Blue), IOUT (Green)
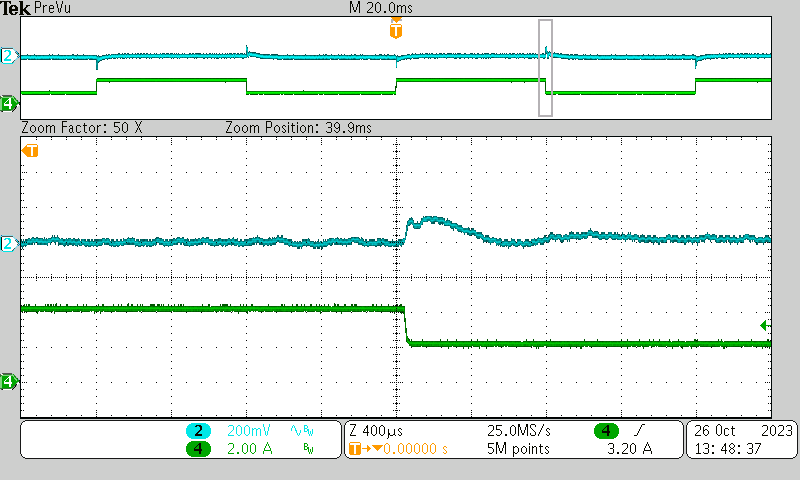 Figure 3-42 2-A to 4-A Load Dynamic at
1000 VIN, Zoom of Overshoot VOUT (Blue),
IOUT (Green)