TIDT397 October 2024
2.3 Efficiency
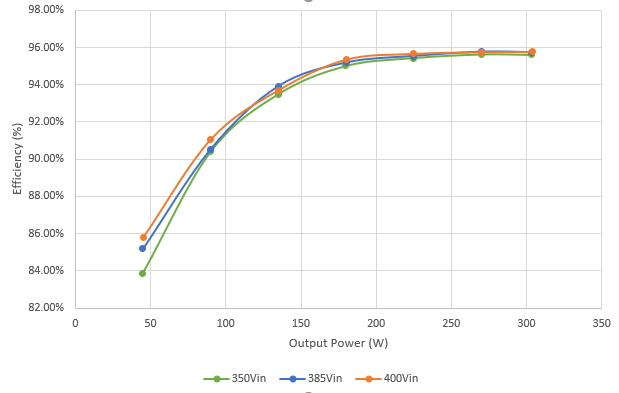
Figure 2-14 illustrates PMP23463 efficiency at different input voltages.
 Figure 2-14 Efficiency(%) Versus Load Current (A)
Input Voltage (V) | Input Current (A) | Output Voltage (V) | Output Current (A) | Input Power (W) | Output Power (W) | Efficiency (%) |
|---|---|---|---|---|---|---|
350 | 0.153 | 22.49 | 1.997 | 53.55 | 44.913 | 83.87% |
350 | 0.284 | 22.48 | 3.997 | 99.40 | 89.853 | 90.39% |
350 | 0.412 | 22.48 | 5.997 | 144.20 | 134.81 | 93.49% |
349.9 | 0.541 | 22.49 | 7.997 | 189.30 | 179.85 | 95.01% |
349.9 | 0.673 | 22.48 | 9.997 | 235.48 | 224.73 | 95.43% |
349.9 | 0.806 | 22.48 | 11.997 | 282.02 | 269.69 | 95.63% |
349.9 | 0.907 | 22.48 | 13.497 | 317.36 | 303.41 | 95.61% |
385 | 0.137 | 22.50 | 1.997 | 52.745 | 44.933 | 85.19% |
385 | 0.258 | 22.50 | 3.997 | 99.33 | 89.933 | 90.54% |
385 | 0.373 | 22.49 | 5.997 | 143.61 | 134.87 | 93.92% |
385 | 0.491 | 22.50 | 7.997 | 189.04 | 179.93 | 95.18% |
385 | 0.611 | 22.48 | 9.997 | 235.24 | 224.73 | 95.54% |
384.9 | 0.732 | 22.49 | 11.997 | 281.75 | 269.81 | 95.76% |
384.9 | 0.823 | 22.47 | 13.497 | 316.77 | 303.28 | 95.74% |
400 | 0.131 | 22.51 | 1.997 | 52.40 | 44.952 | 85.79% |
400 | 0.247 | 22.51 | 3.997 | 98.80 | 89.972 | 91.07% |
400 | 0.360 | 22.50 | 5.997 | 144.00 | 134.93 | 93.70% |
400 | 0.472 | 22.51 | 7.997 | 188.80 | 180.01 | 95.35% |
399.9 | 0.588 | 22.50 | 9.997 | 235.14 | 224.93 | 95.66% |
399.9 | 0.705 | 22.50 | 11.997 | 281.93 | 269.93 | 95.74% |
399.9 | 0.793 | 22.50 | 13.497 | 317.12 | 303.68 | 95.76% |