TIDUCJ0G November 2016 – April 2020
7.1.2 Steady State Condition
Steady state current waveform are shown in Figure 55 and Figure 56 for different load conditions 612 W and 1364 W, respectively.
Figure 55. Steady State 208-Vac IN, 600-V DC OUT 612W, iTHD 2.5%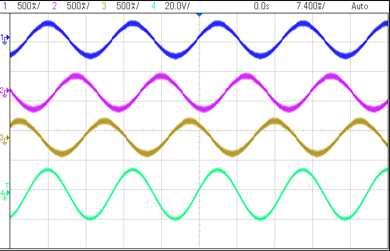

Figure 56. Steady State 208-Vac, IN 600-V DC OUT 1364W, iTHD 0.96%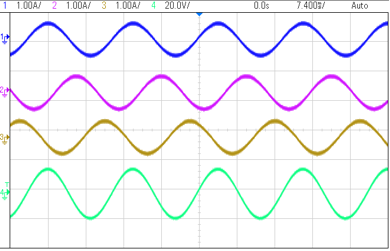

Table 4 lists the detailed test results of this design below varying load conditions with 208-Vac input and 600-V DC output.
Table 4. Detailed Test Results With 208Vac IN, 600V DC OUT, and Varying Power Levels
| Vbus_PM | Vbus_MN | VoutTotal | PIN | Iout | Pout | Eff | THD% | PF |
|---|---|---|---|---|---|---|---|---|
| 297.85 | 300.5 | 598.35 | 74 | 0.117 | 70.00695 | 0.946039865 | 23.20% | 0.8263 |
| 298.58 | 300 | 598.58 | 124.4 | 0.2 | 119.716 | 0.962347267 | 17% | 0.9206 |
| 299.12 | 299.8 | 598.92 | 245.1 | 0.4 | 239.568 | 0.977429621 | 8.09% | 0.9777 |
| 299.78 | 299 | 598.78 | 481.3 | 0.788 | 471.83864 | 0.980342074 | 3% | 0.994 |
| 299.52 | 299.6 | 599.12 | 623.7 | 1.022 | 612.30064 | 0.981723008 | 2.54% | 0.9964 |
| 299.66 | 299.4 | 599.06 | 858.8 | 1.405 | 841.6793 | 0.980064392 | 1.71% | 0.998 |
| 299.84 | 299.1 | 598.94 | 1001.6 | 1.637 | 980.46478 | 0.978898542 | 1.52% | 0.9984 |
| 299.3 | 299.82 | 599.12 | 1150.6 | 1.878 | 1125.14736 | 0.977878811 | 1.22% | 0.9988 |
| 300.13 | 298.8 | 598.93 | 1399.7 | 2.278 | 1364.36254 | 0.974753547 | 0.96% | 0.999 |
Figure 57 shows the efficiency data plotted below these test conditions.
Figure 57. Efficiency at 208-Vac IN and 600-V DC OUT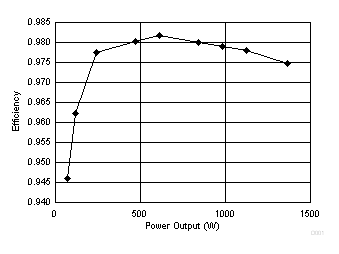

Figure 58 shows the THD data plotted below these test conditions.
Figure 58. THD at 208-Vac IN and 600-V DC OUT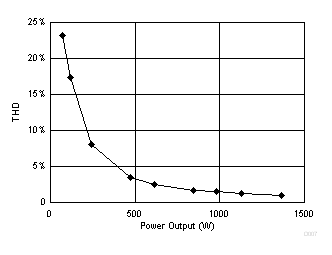

Figure 59 shows the PF data plotted below these test conditions.
Figure 59. PF at 208-Vac IN and 600-V DC OUT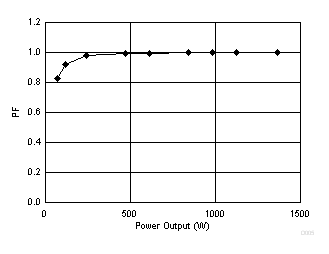

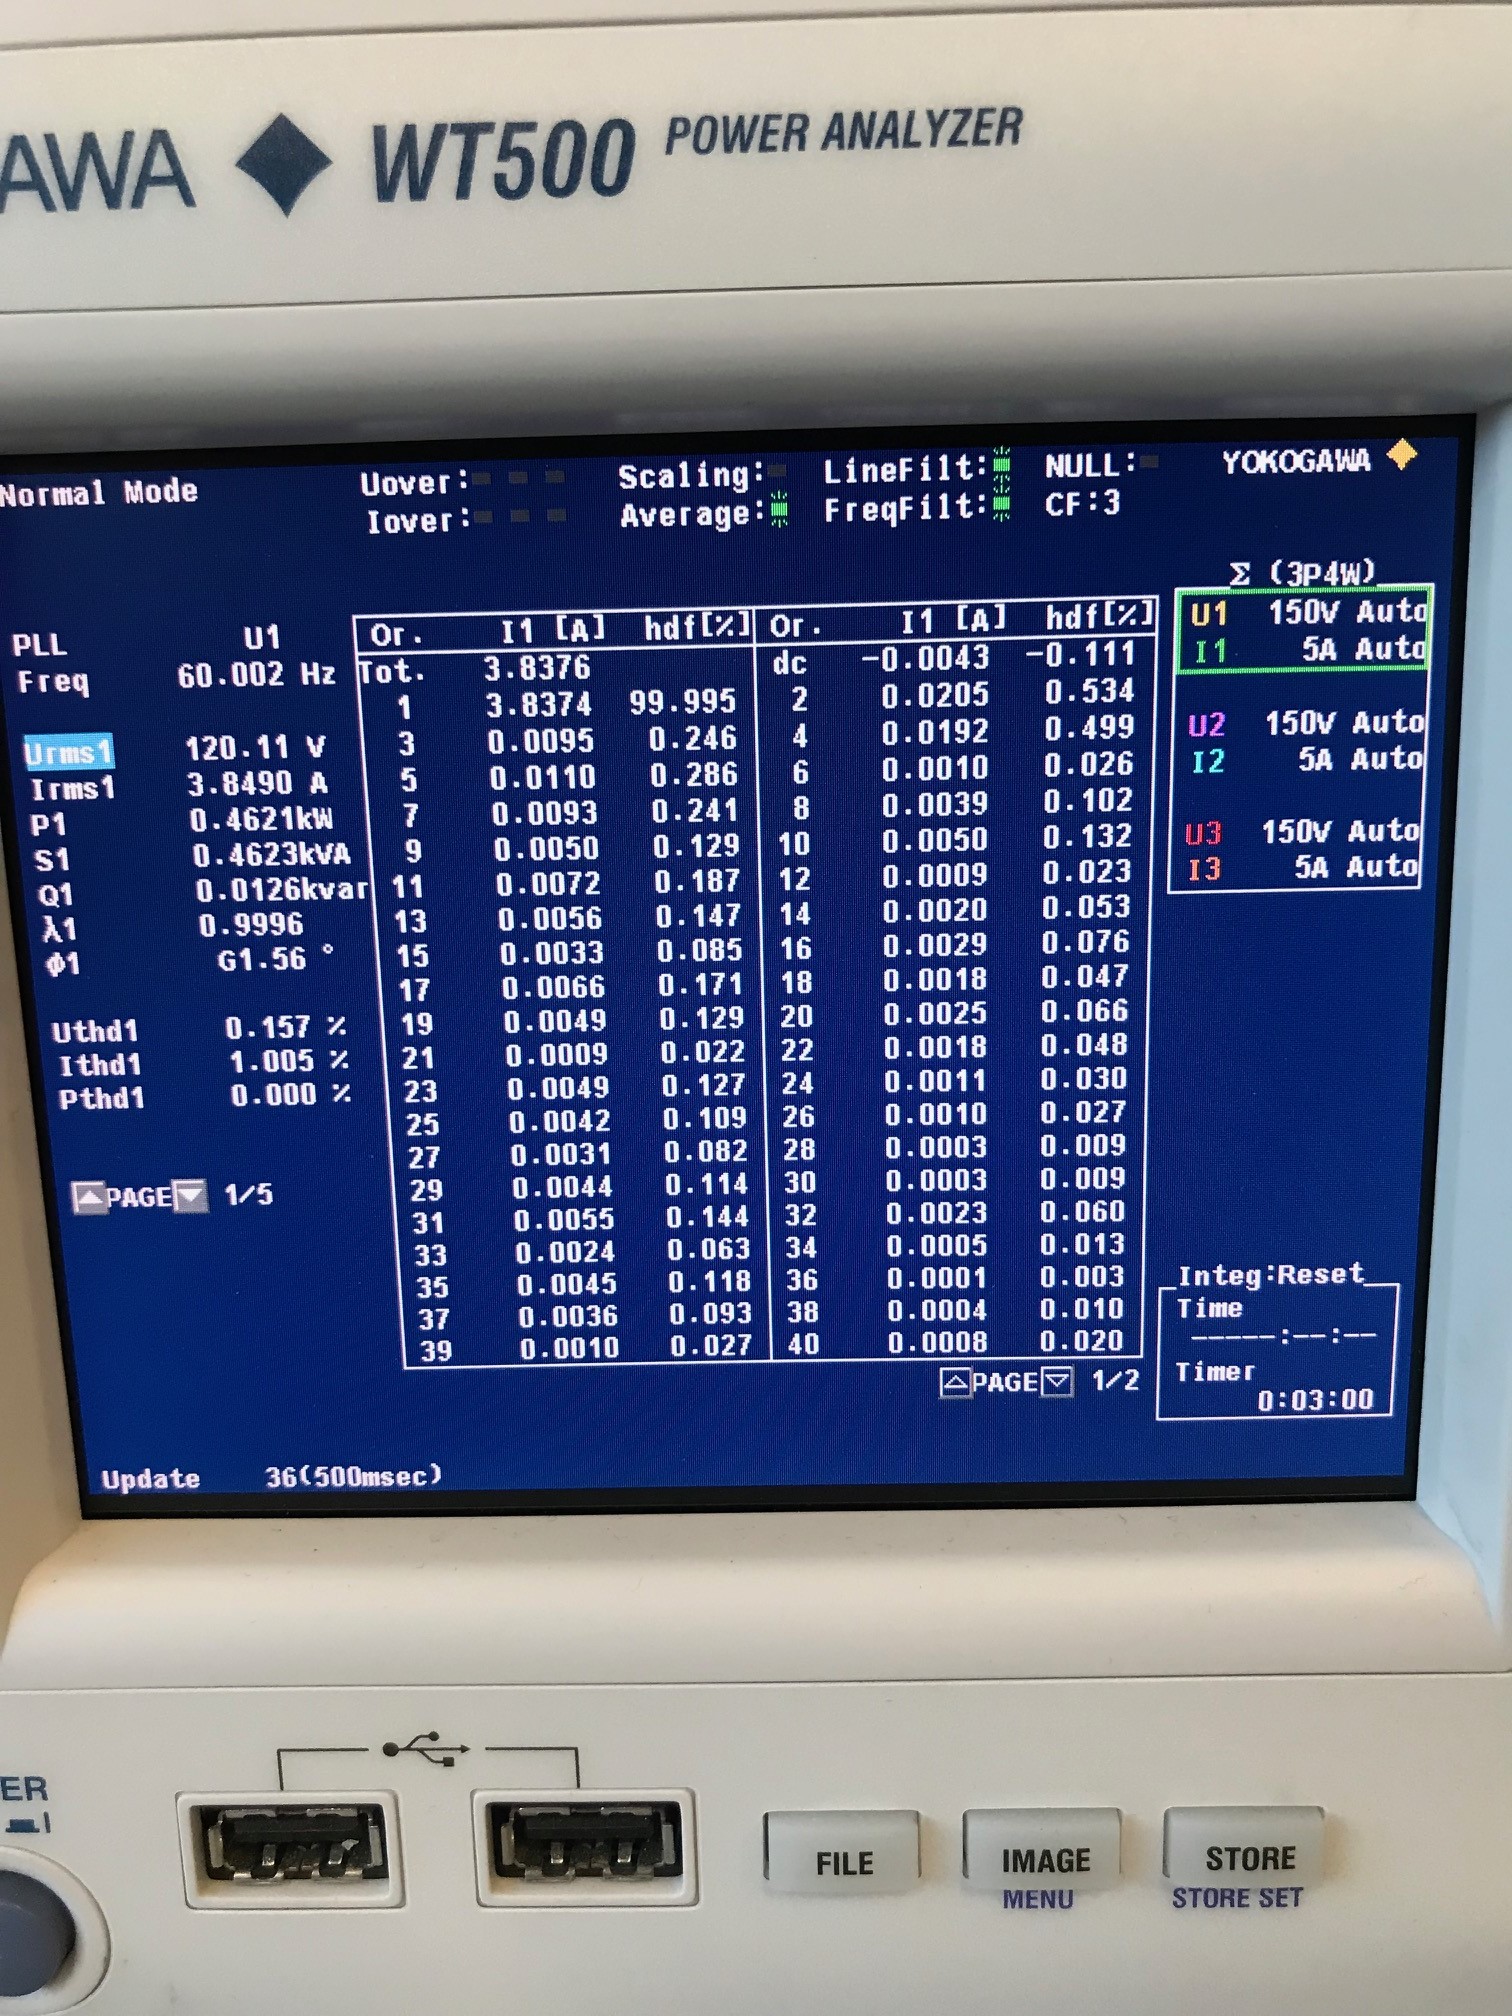
Figure 60 shows the power analyzer capture of the harmonics of the current when operating at 208Vrms input, 600V DC output and 1.2kW load.
