TIDUCJ0G November 2016 – April 2020
7.2.1 Steady State Condition
Steady state current waveform for input Vac 400-Vrms/50H and output 700-V DC are shown in Figure 66 and Figure 67 for different load conditions 960 W and 1865 W, respectively.
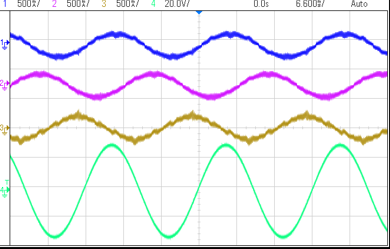
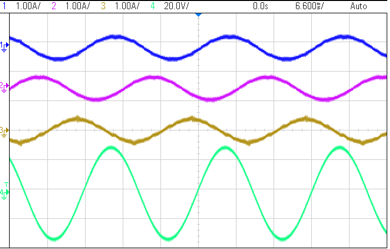
Table 5 lists the detailed test results of this design under varying load conditions.
Table 5. Detailed Test Results With 400-Vac IN, 700-V DC OUT, and Varying Power Levels
| Vbus_PM | Vbus_MN | VoutTotal | PIN | Iout | Pout | Eff | THD% | PF |
|---|---|---|---|---|---|---|---|---|
| 349.41 | 351.2 | 700.61 | 101.9 | 0.137 | 95.98357 | 0.941938862 | 29.10% | 0.7526 |
| 349.41 | 351.9 | 701.31 | 265.3 | 0.37 | 259.4847 | 0.978080286 | 22% | 0.9309 |
| 349.43 | 352 | 701.43 | 581.9 | 0.819 | 574.47117 | 0.987233494 | 11.30% | 0.9823 |
| 349.49 | 351.8 | 701.29 | 900.7 | 1.27 | 890.6383 | 0.988829022 | 7% | 0.9922 |
| 349.46 | 351.9 | 701.36 | 1094.6 | 1.543 | 1082.19848 | 0.988670272 | 6.20% | 0.9982 |
| 349.61 | 351.7 | 701.31 | 1354.1 | 1.913 | 1341.60603 | 0.990773229 | 5.20% | 0.9964 |
| 349.64 | 351.4 | 701.04 | 1553.4 | 2.191 | 1535.97864 | 0.988785014 | 4.70% | 0.9972 |
| 349.75 | 351.2 | 700.95 | 1884.4 | 2.66 | 1864.527 | 0.989453938 | 3.50% | 0.998 |
Figure 68 shows the efficiency data plotted under these test conditions.
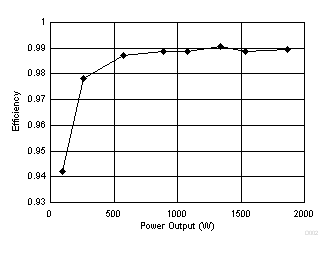
Figure 69 shows the THD data plotted under these test conditions.
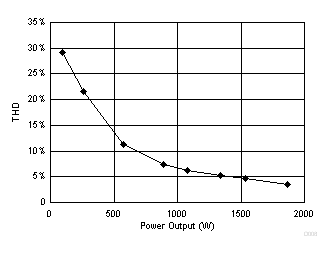
Figure 70 shows the PF data plotted under these test conditions.
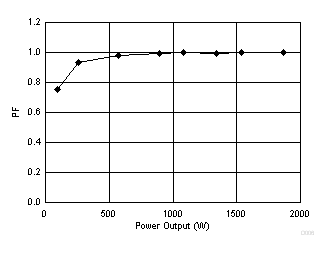
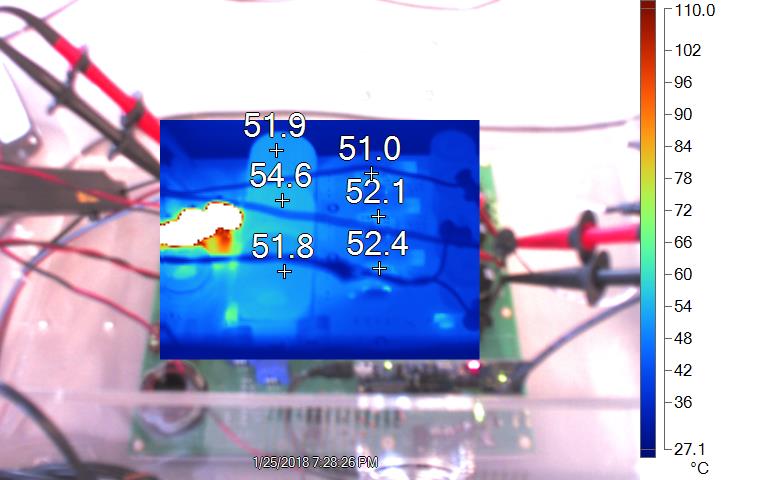
Figure 71 shows the thermal camera image when operating the board is at 2.4 kW. Except for the inrush-current control thermistors, the board runs below 60º Celsius. Figure 71 shows thermal image of the vienna rectifier board when operating at 2.4 kW with high-line 230-Vrms L-N input voltage and 700-V DC bus output voltage.
