TIDUEM8B March 2019 – February 2021
2.3.2.3.1 per_sample_dsp()
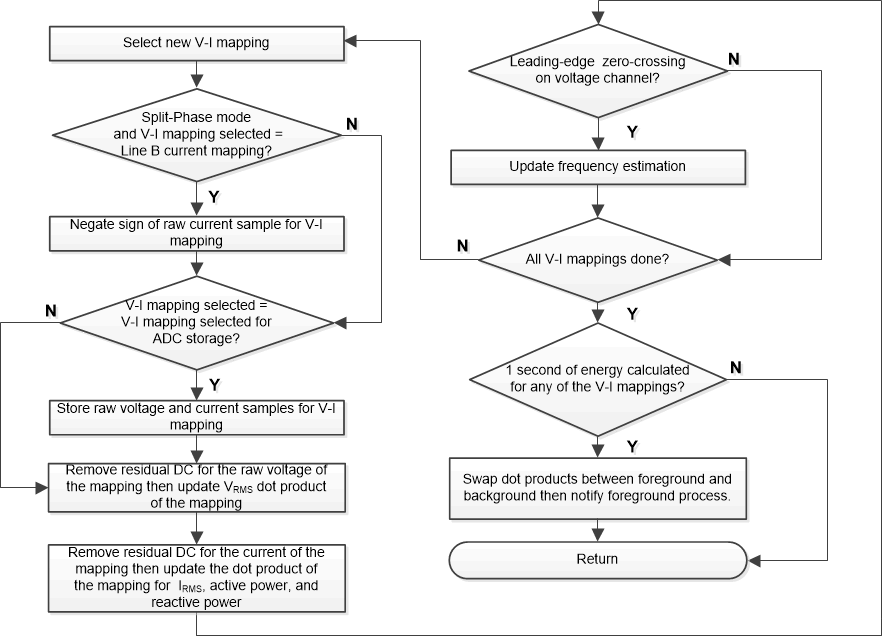
Figure 2-14 shows the flowchart for the per_sample_dsp() function. The per_sample_dsp() function is used to calculate intermediate dot product results that are fed into the foreground process for the calculation of metrology readings. Both voltage and current samples are processed and accumulated in dedicated 64-bit registers. Per-phase active power and reactive power are also accumulated in 64-bit registers.
 Figure 2-14 per_sample_dsp Function
After sufficient samples (of approximately one second) are accumulated, the foreground function is triggered to calculate the final values of VRMS; IRMS; active, reactive, and apparent powers; active, reactive, and apparent energy; frequency; and power factor. In the test software, there are two sets of dot products for a phase: at any given time, one is used by the foreground for calculation and the other used as the working set by the background. After the background process has sufficient samples, it swaps the two dot products so that the foreground uses the newly acquired dot products that the background process just calculated and the background process uses a new empty set to calculate the next set of dot products. Whenever there is a leading-edge zero-crossing (− to + voltage transition) on a voltage channel, the per_sample_dsp() function is also responsible for updating the corresponding frequency (in samples per cycle) of the phase.
The following sections describe the various elements of electricity measurement in the per_sample_dsp() function.