TIDUF99 November 2024
- 1
- Description
- Resources
- Features
- Applications
- 6
- 1System Description
- 2System Overview
- 3System Design Theory
- 4Hardware, Software, Testing Requirements, and Test Results
- 5Design and Documentation Support
- 6About the Author
4.4.2 Switching Mode Test Result
In switching mode, the power switch starts to switch to operate the active MPPT algorithm. Table 4-6 through Table 4-5 and Figure 4-5 show the test results for different power ratings and currents.
For 400W panels, set a constant output current at 9A, peak efficiency is achieved at 98.7% for power higher than 300W. At 300W output power, the converter works in buck-boost mode. At 400W output power, the converter works in boost mode, see Table 4-6. At other power points, the converter works in buck mode.
For 500W panels, set a constant output current at 12A, peak efficiency is achieved at 98.8% at 500W full load condition. At 500W output power, the converter works in buck-boost mode, see Table 4-4. At other power points, the converter works in buck mode.
For 600W panels, at 15A constant output current condition, peak efficiency is achieved at 99.0% at 600W full load, see Table 4-5. At 18A constant output current condition, peak efficiency is also achieved at 98.6% at full load. At all power points, the converter works in buck mode.
| OUTPUT POWER | 20W | 40W | 80W | 120W | 200W | 300W | 400W |
|---|---|---|---|---|---|---|---|
| Vin = 33V, Iout = 9A | 89.9% | 94.2% | 96.6% | 97.5% | 98.5% | 98.7% | 98.7% |
| OUTPUT POWER | 25W | 50W | 100W | 150W | 250W | 375W | 500W |
|---|---|---|---|---|---|---|---|
Vin = 43V, Iout = 12A | 83.9% | 92.3% | 95.8% | 96.8% | 97.8% | 98.7% | 98.8% |
| OUTPUT POWER | 30W | 60W | 120W | 180W | 300W | 450W | 600W |
|---|---|---|---|---|---|---|---|
Vin = 43V, Iout = 15A | 83.8% | 91.6% | 95.2% | 96.4% | 97.6% | 98.5% | 99.0% |
Vin = 43V, Iout = 18A | 80.6% | 89.2% | 93.7% | 95.7% | 97.0% | 97.9% | 98.6% |
 Figure 4-5 Switching Mode Efficiency
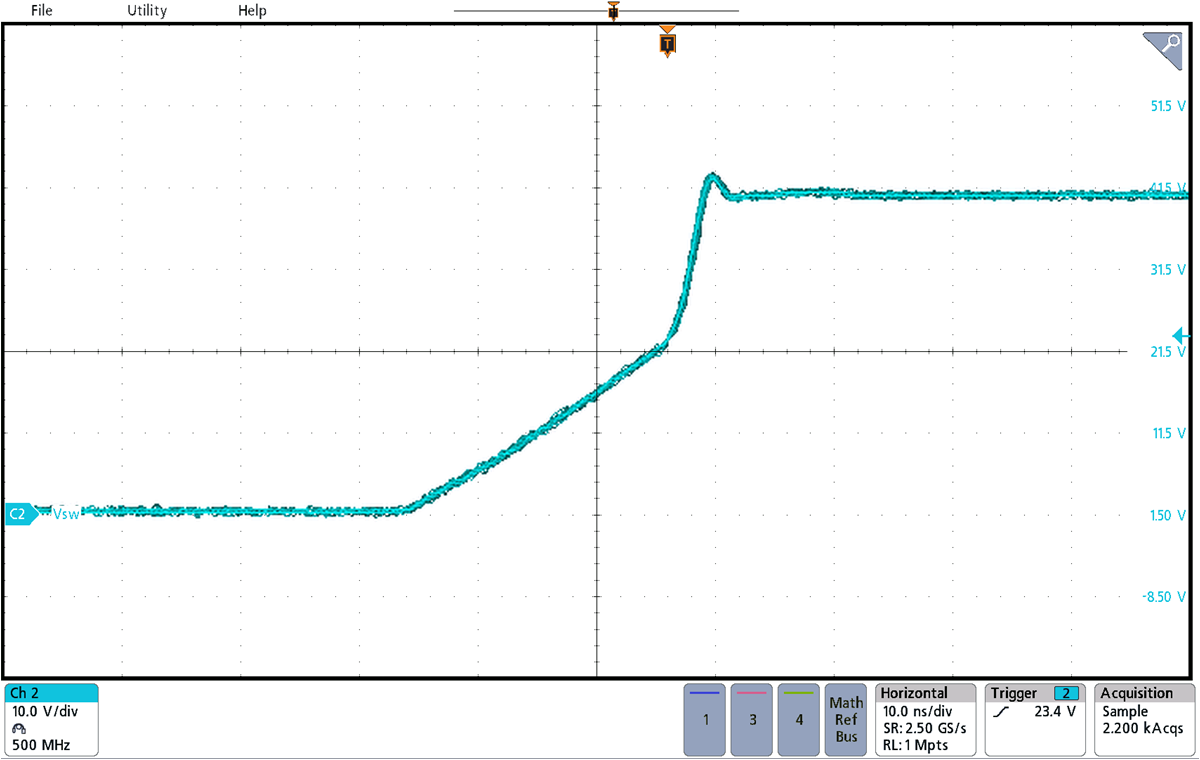
Figure 4-6 shows the switching node waveform in buck stage. Overshoot is very small and there is no obvious ringing.
 Figure 4-6 No Load Switching Node Waveform, Buck Stage
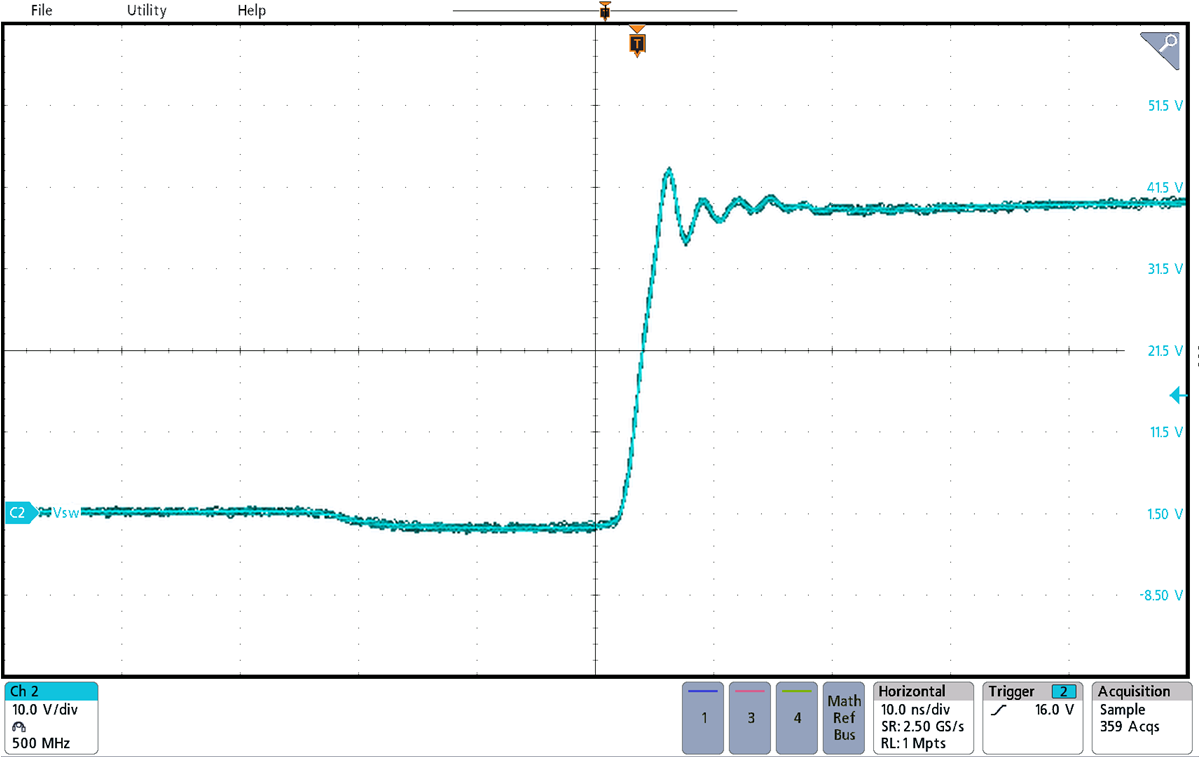
 Figure 4-7 Switching Node Waveform Rising Edge With Full Load, Buck Stage
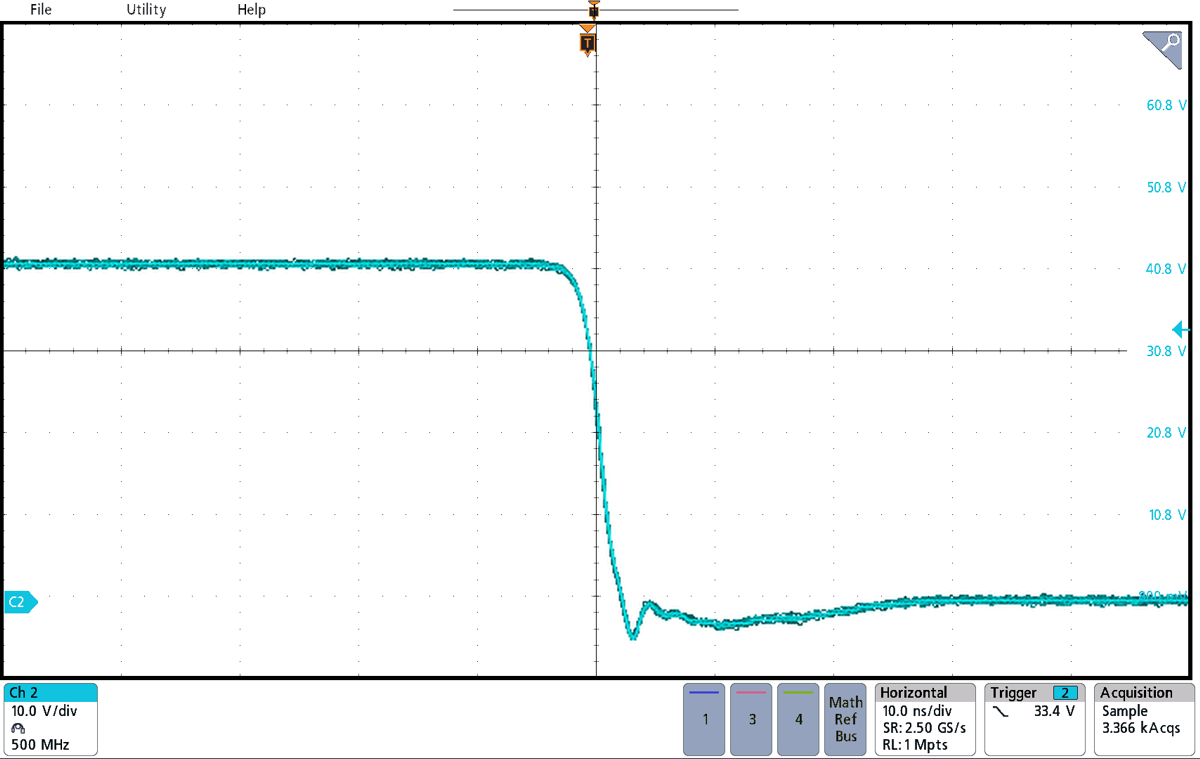
 Figure 4-8 Switching Node Waveform Falling Edge With Full Load, Buck Stage
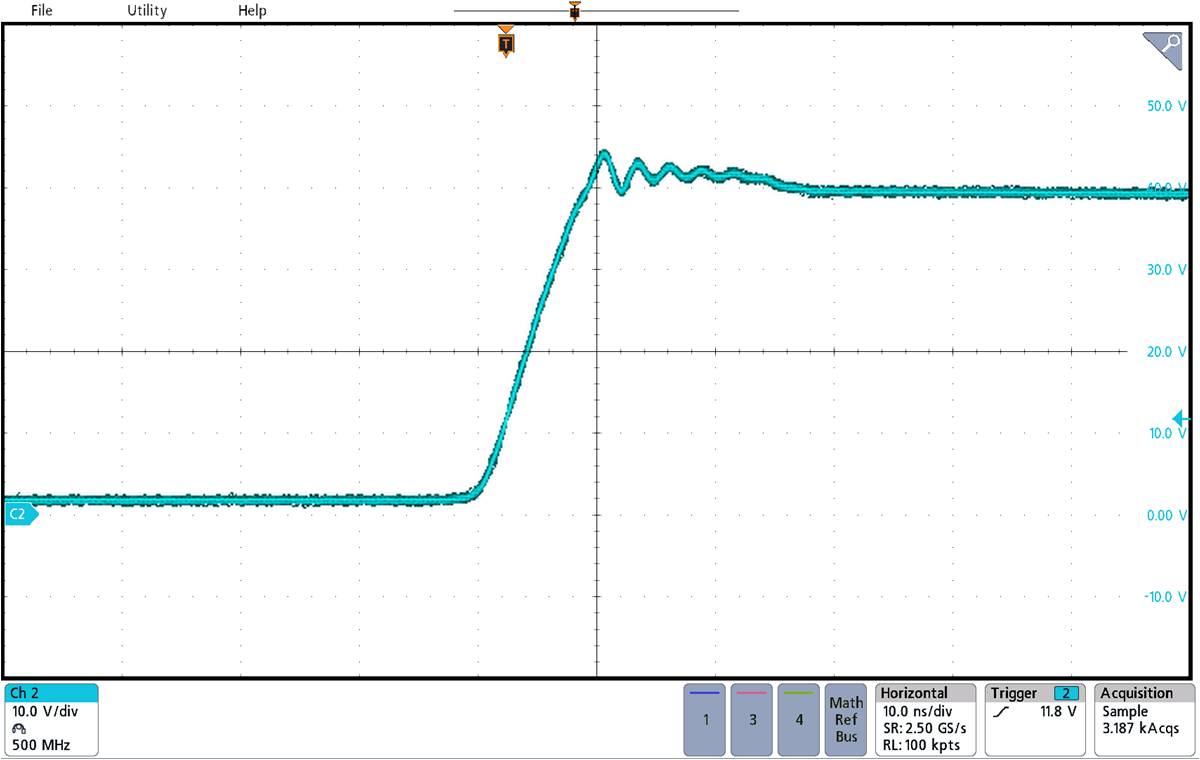
Figure 4-9 shows the switching node waveform in boost stage. The waveform is also clean.
 Figure 4-9 Switching Node Waveform With Full Load, Boost Stage