TIDUF99 November 2024
- 1
- Description
- Resources
- Features
- Applications
- 6
- 1System Description
- 2System Overview
- 3System Design Theory
- 4Hardware, Software, Testing Requirements, and Test Results
- 5Design and Documentation Support
- 6About the Author
4.4.4 PLC Test Results
Testing the PLC hardware implementation includes validating the coupling circuit and the band-pass filter in the receive path.
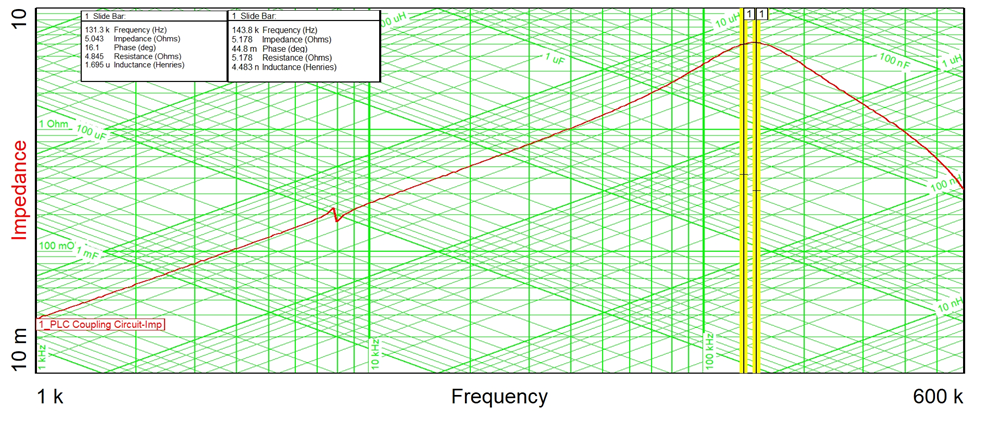
To check the coupling circuit, the impedance was measured using a frequency response analyzer (Venable Instruments Model 3120). Importantly, the coupling network needs to present a high impedance at the PLC carrier frequencies and maintains lower impedances outside the communication band. Figure 4-12 shows the measured impedance. Yellow markers highlight the impedance at the mark and space frequencies of the RSD PLC protocol.
 Figure 4-12 Impedance Coupling
Circuit
Figure 4-12 Impedance Coupling
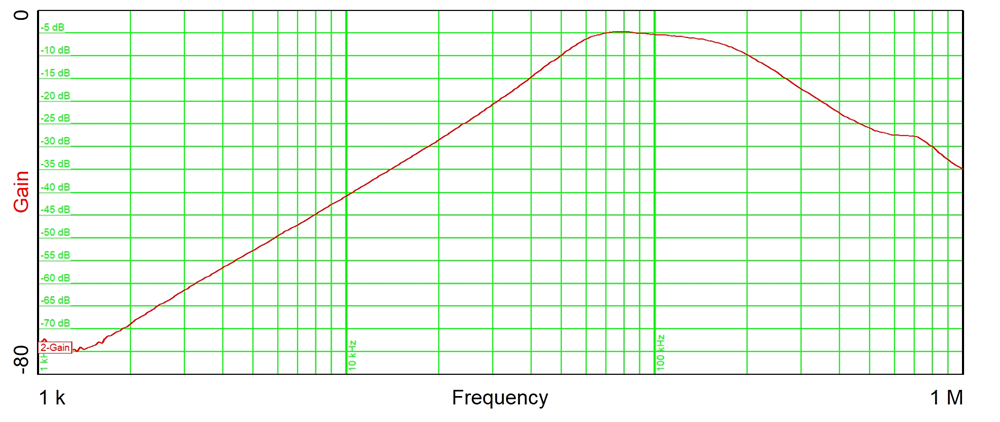
CircuitAn additional band-pass filter is implemented in the receive path. In this path it is important that the pass band is set to the carrier frequencies of the PLC communication. Figure 4-13 shows the measured transfer curve of the bandpass filter. The pass band is located between 70kHz and 150kHz. The same frequency response analyzer was used for this measurement.
 Figure 4-13 Transfer Curve Band-Pass
Filter Receive Path
Figure 4-13 Transfer Curve Band-Pass
Filter Receive PathThis design verified the PLC coupling circuit and AFE031 with rapid shutdown function in combination with the TIDA-060001 reference design. See also SunSpec Rapid Shutdown Transmit and Receive Reference Design.