ZHCU734A January 2017 – March 2020
3.2.3.2.2.4 Debug Environment Windows
It is standard debug practice to watch local and global variables while debugging code. There are various methods for doing this in CCs, such as memory windows and watch windows. Additionally, CCS has the ability to make time (and frequency) domain plots, which allows the user to view waveforms using graph windows.
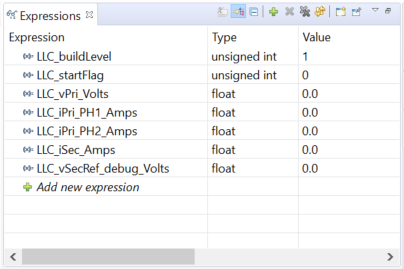
- Populate the Expressions Window entries by clicking on View → Scripting console on the menu bar and then opening the setupdebugenv_lab2.js file from the project directory using the scripting console Open File (
 ) command. The Expressions Window should look like Figure 29.
Table 5. Lab 2 Description of Expressions Window Entries
| VARIABLE | DESCRIPTION |
| LLC_buildLevel | Shows which lab is loaded. |
| LLC_startFlag | Set this variable to 1 to start the power stage. |
| LLC_vPri_Volts | Input voltage in Volts. Only valid if jumper J15 is populated on the TIDM-1001 board. |
| LLC_iPri_PH1_Amps | The primary tank current in phase 1 in Amps. |
| LLC_iPri_PH2_Amps | The primary tank current in phase 2 in Amps. |
| LLC_iSec_Amps | Secondary (output) current in Amps. |
| LLC_vSecRef_debug_Volts | This variable allows the user to set the desired regulation voltage. |
