ZHCSOP5B august   2021  – june 2023 AFE7900

PRODUCTION DATA  

  1.   1
  2. 1特性
  3. 2应用
  4. 3说明
  5. 4Revision History
  6. 5Specifications
    1. 5.1  Absolute Maximum Ratings
    2. 5.2  ESD Ratings
    3. 5.3  Recommended Operating Conditions
    4. 5.4  Thermal Information
    5. 5.5  Transmitter Electrical Characteristics
    6. 5.6  RF ADC Electrical Characteristics
    7. 5.7  PLL/VCO/Clock Electrical Characteristics
    8. 5.8  Digital Electrical Characteristics
    9. 5.9  Power Supply Electrical Characteristics
    10. 5.10 Timing Requirements
    11. 5.11 Switching Characteristics
    12. 5.12 Typical Characteristics
      1. 5.12.1  RX Typical Characteristics 30 MHz and 400 MHz
      2. 5.12.2  RX Typical Characteristics at 800MHz
      3. 5.12.3  RX Typical Characteristics 1.75GHz to 1.9GHz
      4. 5.12.4  RX Typical Characteristics 2.6GHz
      5. 5.12.5  RX Typical Characteristics 3.5GHz
      6. 5.12.6  RX Typical Characteristics 4.9GHz
      7. 5.12.7  TX Typical Characteristics at 30MHz and 400MHz
      8. 5.12.8  TX Typical Characteristics at 800MHz
      9. 5.12.9  TX Typical Characteristics at 1.8GHz
      10. 5.12.10 TX Typical Characteristics at 2.6GHz
      11. 5.12.11 TX Typical Characteristics at 3.5GHz
      12. 5.12.12 TX Typical Characteristics at 4.9GHz
      13. 5.12.13 TX Typical Characteristics at 7.1GHz
      14. 5.12.14 PLL and Clock Typical Characteristics
  7. 6Device and Documentation Support
    1. 6.1 接收文档更新通知
    2. 6.2 支持资源
    3. 6.3 商标
    4. 6.4 静电放电警告
    5. 6.5 术语表
  8. 7Mechanical, Packaging, and Orderable Information

封装选项

机械数据 (封装 | 引脚)
散热焊盘机械数据 (封装 | 引脚)
订购信息

RX Typical Characteristics 4.9GHz

Typical values at TA = +25°C, ADC Sampling Rate = 2949.12 GHz. Default conditions: output sample rate = 491.52MSPS (decimate by 6), PLL clock mode with fREF = 491.52MHz, AIN = –3 dBFS, DSA setting = 4 dB.
GUID-37C8F020-C158-4DCE-A610-42EEDCFBB448-low.gif
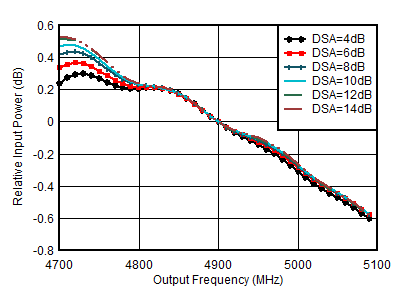
With matching, normalized to power at 4.9GHz for each DSA setting
Figure 5-173 RX Inband Gain Flatness, fIN = 4900 MHz
GUID-3D3D6149-DB61-4BB4-9B93-336860E01A81-low.gif
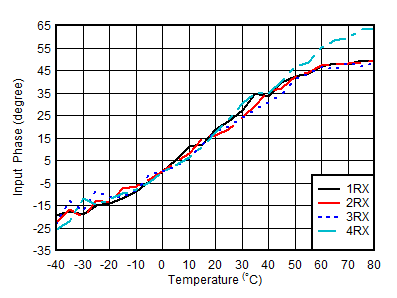
With 4.9 GHz matching, normalized to phase at 25°C
Figure 5-175 RX Input Phase vs Temperature and DSA at fOUT = 4.9 GHz
GUID-BF6C2D49-FA35-469C-86E3-D460F0CC7C5D-low.gif
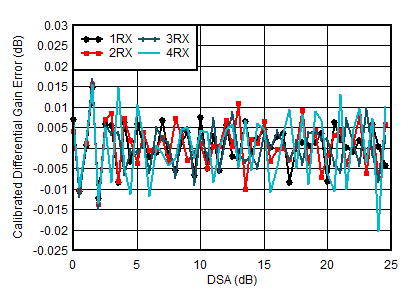
With 4.9 GHz matching
Differential Amplitude Error = PIN(DSA Setting – 1) – PIN(DSA Setting) + 1
Figure 5-177 RX Calibrated Differential Amplitude Error vs DSA Setting at 4.9 GHz
GUID-C47811CF-D95B-41C7-937B-9D9E21BACB30-low.gif
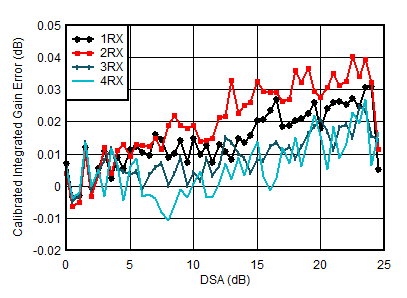
With 4.9 GHz matching
Integrated Amplitude Error = PIN(DSA Setting) – PIN(DSA Setting = 0) + (DSA Setting)
Figure 5-179 RX Calibrated Integrated Amplitude Error vs DSA Setting at 4.9 GHz
GUID-85AE6422-ED4C-48F9-A065-5DAEDBCFDA82-low.gif
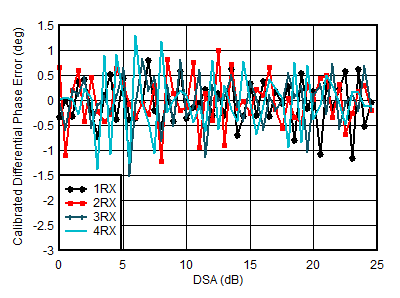
With 4.9 GHz matching
Differential Phase Error = PhaseIN(DSA Setting – 1) – PhaseIN(DSA Setting)
Figure 5-181 RX Calibrated Differential Phase Error vs DSA Setting at 4.9 GHz
GUID-FFD73826-22DA-4861-A15A-39834CC5427F-low.gif
With 4.9 GHz matching
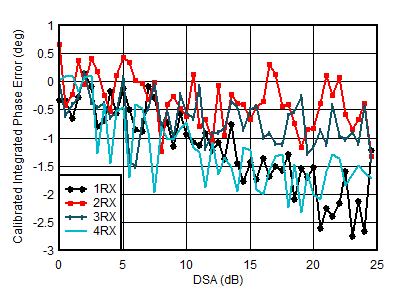
Integrated Phase Error = Phase(DSA Setting) – Phase(DSA Setting = 0)
Figure 5-183 RX Calibrated Integrated Phase Error vs DSA Setting at 4.9 GHz
GUID-7492E05C-E451-4106-A520-6ACF65DF2DA4-low.gif
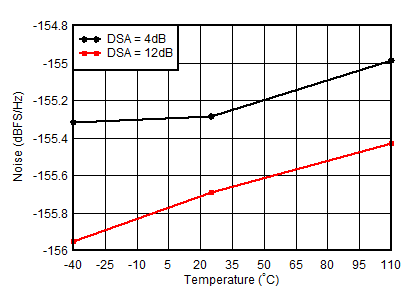
With 4.9 GHz matching, 12.5-MHz offset from tone
Figure 5-185 RX Noise Spectral Density vs Temperature at 4.9 GHz
GUID-37ADF6E8-1197-4274-8020-0085183BDEC9-low.gif
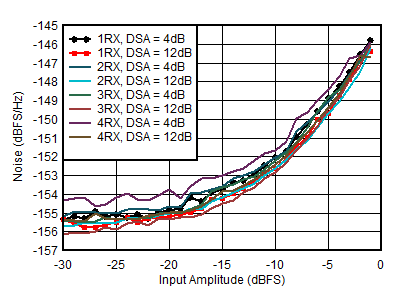
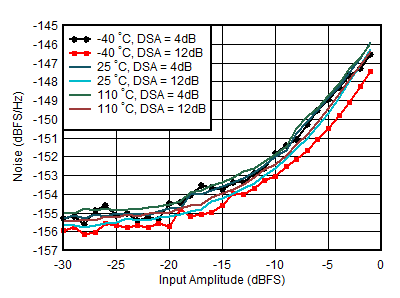
With 4.9 GHz matching, 12.5-MHz offset from tone
Figure 5-187 RX Noise Spectral Density vs Input Amplitude and Channel at 4.9 GHz
GUID-F8B40B98-F20D-47F8-AA7A-37E2A8F85072-low.gif
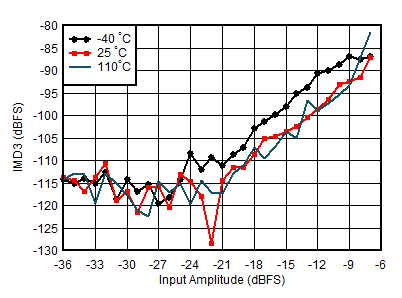
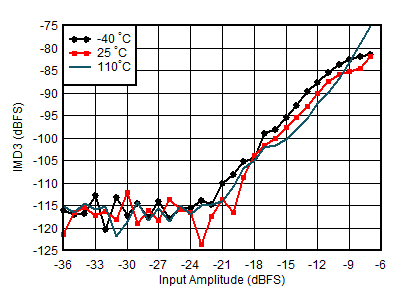
With 4.9 GHz matching, tone spacing = 20 MHz, DSA = 4 dB
Figure 5-189 RX IMD3 vs Input Level and Temperature at 4.9 GHz
GUID-BC4F6BE9-CEF7-432B-B8FB-E7493C4F0675-low.gif
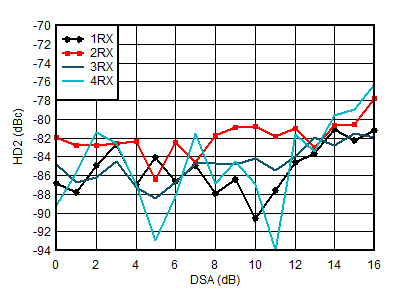
With 4.9 GHz matching, measured after HD2 trim, DDC bypass mode (TI only mode for characterization)
Figure 5-191 RX HD2 vs DSA Setting and Channel at 4.9 GHz
GUID-AD8534A6-68E4-4CC2-9B0D-138C0834CAA3-low.gif
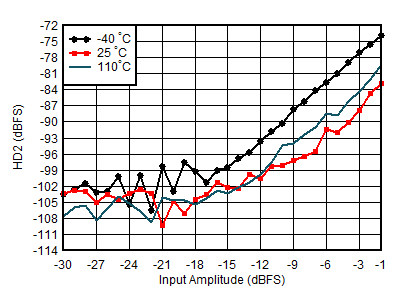
With 4.9 GHz matching, measured after HD2 trim, DDC bypass mode (TI only mode for characterization)
Figure 5-193 RX HD2 vs Input Level and Temperature at 4.9 GHz
GUID-E3B0F709-A945-48ED-A0DF-6E1D6ACB4DA5-low.gif
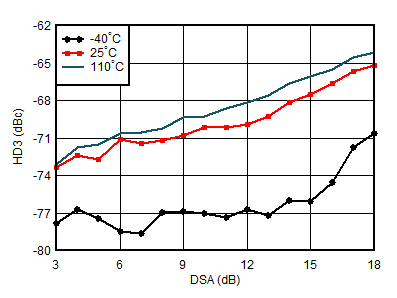
With 4.9 GHz matching, DDC bypass mode (TI only mode for characterization)
Figure 5-195 RX HD3 vs DSA Setting and Temperature at 4.9 GHz
GUID-3C8E1935-D54C-49C8-8D08-973999924D18-low.gif
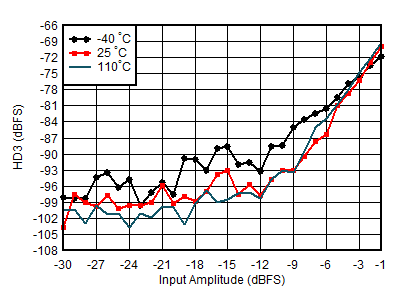
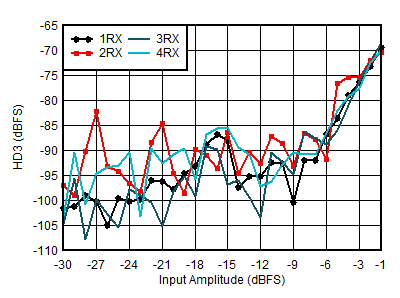
With 4.9 GHz matching, DDC bypass mode (TI only mode for characterization)
Figure 5-197 RX HD3 vs Input Level and Temperature at 4.9 GHz
GUID-89F24815-A60C-41AF-B14E-6FF111217662-low.gif
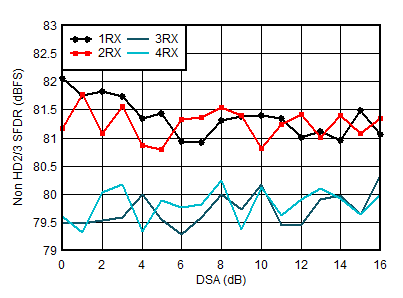
With 4.9 GHz matching
Figure 5-199 RX Non-HD2/3 vs DSA Setting at 4.9 GHz
GUID-33EEDBE5-F750-4422-B288-53A215A1264C-low.gif
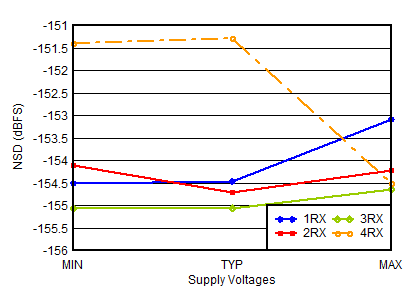
With 4.9 GHz matching, 12.5-MHz offset, all supplies at MIN, TYP, or MAX recommended operating voltages
Figure 5-201 RX Noise Spectral Density vs Supply and Channel at 4.9 GHz
GUID-618CFCAD-E82A-40FB-9192-5D92DC80AC28-low.gif
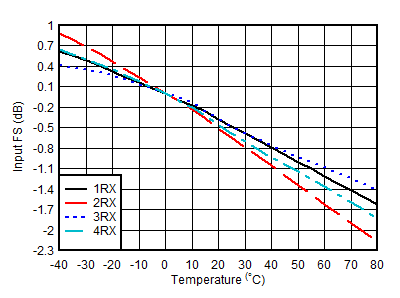
With 4.9 GHz matching, normalized to fullscale at 25°C for each channel
Figure 5-174 RX Input Fullscale vs Temperature and Channel at 4.9 GHz
GUID-ADC851C0-BE56-451C-A2CB-B6B477840942-low.gif
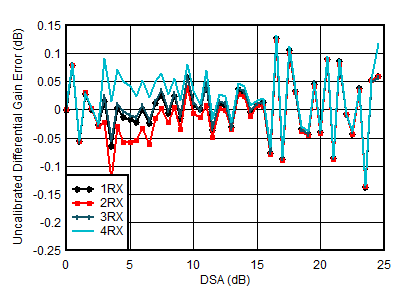
With 4.9 GHz matching
Differential Amplitude Error = PIN(DSA Setting – 1) – PIN(DSA Setting) + 1
Figure 5-176 RX Uncalibrated Differential Amplitude Error vs DSA Setting at 4.9 GHz
GUID-C94A7CD8-36ED-4128-A263-8BFAD92C31C6-low.gif
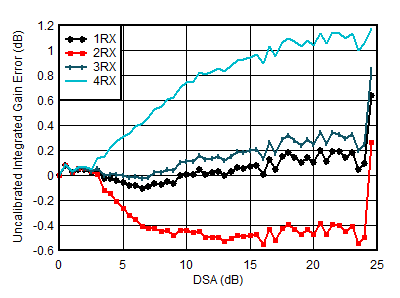
With 4.9 GHz matching
Integrated Amplitude Error = PIN(DSA Setting) – PIN(DSA Setting = 0) + (DSA Setting)
Figure 5-178 RX Uncalibrated Integrated Amplitude Error vs DSA Setting at 4.9 GHz
GUID-94850473-8C3F-4EE0-A263-A00070BD4BB6-low.gif
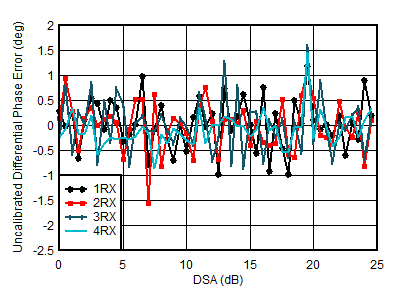
With 4.9 GHz matching
Differential Phase Error = PhaseIN(DSA Setting – 1) – PhaseIN(DSA Setting)
Figure 5-180 RX Uncalibrated Differential Phase Error vs DSA Setting at 4.9 GHz
GUID-28A32794-5F81-499A-8292-83412CFB075C-low.gif
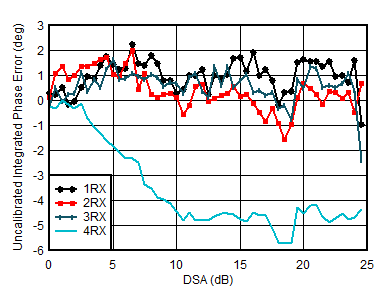
With 4.9 GHz matching
Integrated Phase Error = Phase(DSA Setting) – Phase(DSA Setting = 0)
Figure 5-182 RX Uncalibrated Integrated Phase Error vs DSA Setting at 4.9 GHz
GUID-919357DD-0B50-4EF1-9F3A-CBAB5E4B02E3-low.gif
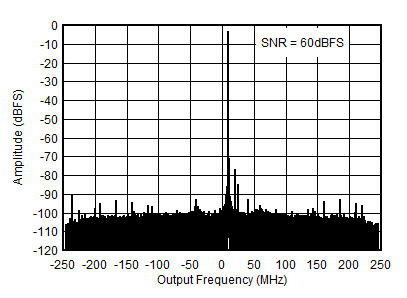
With 4.9 GHz matching, fIN = 4910 MHz, AIN= –3 dBFS
Figure 5-184 RX Output FFT at 4.9 GHz
GUID-6B18302D-0B63-47D6-B98D-3F155E4AA1CF-low.gif
With 4.9 GHz matching, DSA Setting = 12 dB, 12.5-MHz offset from tone
Figure 5-186 RX Noise Spectral Density vs Input Amplitude and Temperature at 4.9 GHz
GUID-B280395F-045F-463F-88B6-CAEF08FC1575-low.gif
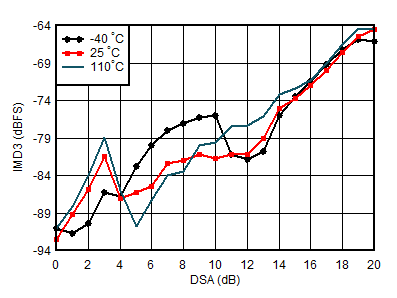
With 4.9 GHz matching, each tone –7 dBFS, tone spacing = 20 MHz
Figure 5-188 RX IMD3 vs DSA Setting and Temperature at 4.9 GHz
GUID-829C99F7-D0F5-4991-95DA-741E155CC76A-low.gif
With 4.9 GHz matching, tone spacing = 20 MHz, DSA = 12 dB
Figure 5-190 RX IMD3 vs Input Level and Temperature at 4.9 GHz
GUID-9995A722-022A-4C07-A3C0-BD1FF60B892C-low.gif
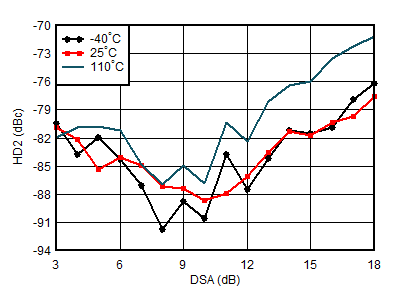
With 4.9 GHz matching, measured after HD2 trim, DDC bypass mode (TI only mode for characterization)
Figure 5-192 RX HD2 vs DSA and Temperature at 4.9 GHz
GUID-4A308707-C934-4C2A-BEB5-B5BE4CC69B88-low.gif
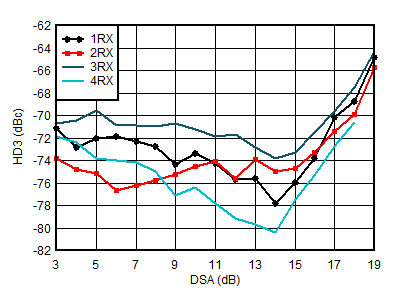
With 4.9 GHz matching, DDC bypass mode (TI only mode for characterization)
Figure 5-194 RX HD3 vs DSA Setting and Channel at 4.9 GHz
GUID-0F4B2667-84EE-4283-812F-244E8F3F96C1-low.gif
With 4.9 GHz matching, DDC bypass mode (TI only mode for characterization)
Figure 5-196 RX HD3 vs Input Level and Channel at 4.9 GHz
GUID-1121E028-B0D4-47BA-AFCB-B9C4FAD80CD9-low.gif
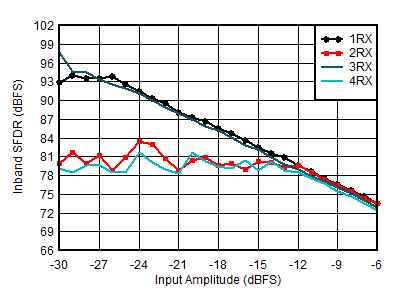
With 4.9 GHz matching, decimate by 3
Figure 5-198 RX In-Band SFDR (±400 MHz) vs Input Amplitude and Channel at 4.9 GHz
GUID-BF38B8B0-8E9F-482E-BB3B-AACF1F23EDF6-low.gif
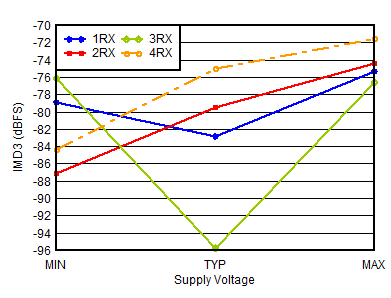
With 4.9 GHz matching, –7 dBFS each tone, 20-MHz tone spacing, all supplies at MIN, TYP, or MAX recommended operating voltages
Figure 5-200 RX IMD3 vs Supply and Channel at 4.9 GHz