ZHCSG36D December 2016 – November 2017 TLV8541 , TLV8542 , TLV8544
UNLESS OTHERWISE NOTED, this document contains PRODUCTION DATA.
- 1 特性
- 2 应用
- 3 说明
- 4 修订历史记录
- 5 说明 (续)
- 6 Pin Configuration and Functions
- 7 Specifications
- 8 Detailed Description
- 9 Application and Implementation
- 10Power Supply Recommendations
- 11Layout
- 12器件和文档支持
- 13机械、封装和可订购信息
9.2.3 Application Curve
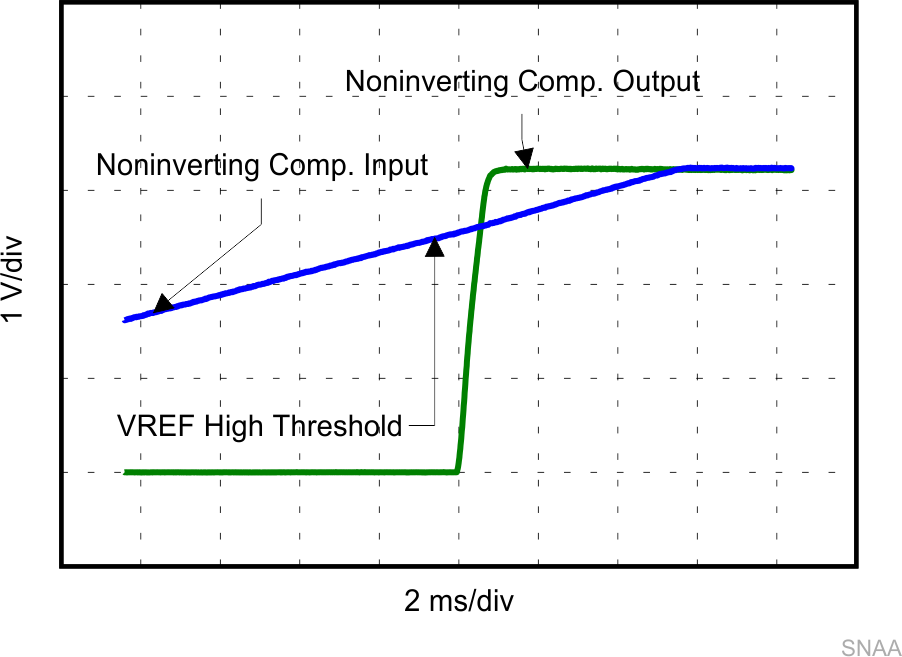
Scope plots of the amplified PIR signal at the input of the noninverting comparator and the corresponding output signal are shown in Figure 34 and Figure 35. As the PIR signal (blue line) crosses the VREF_High threshold, the output of the comparator switches from the cutoff (slightly higher than ground) state to the saturation state (slightly lower than VBAT = 3.3 V). Depending on the speed of the object, the PIR signal peaks to its maximum and roles off within several seconds. When the signal crosses the VREF_High threshold on the way down, the output of the noninverting amplifier toggles back to the cutoff region (low).
The data for plot of Figure 34 was captured using the BOOSTXL-TLV8544PIR board. Because the motion was created at very close proximity of the sensor on the booster board used to collect the data, the signal was limited by the diode in the first stage as shown in the plot.
 Figure 34. Noninverting Comparator Input and Output Signals
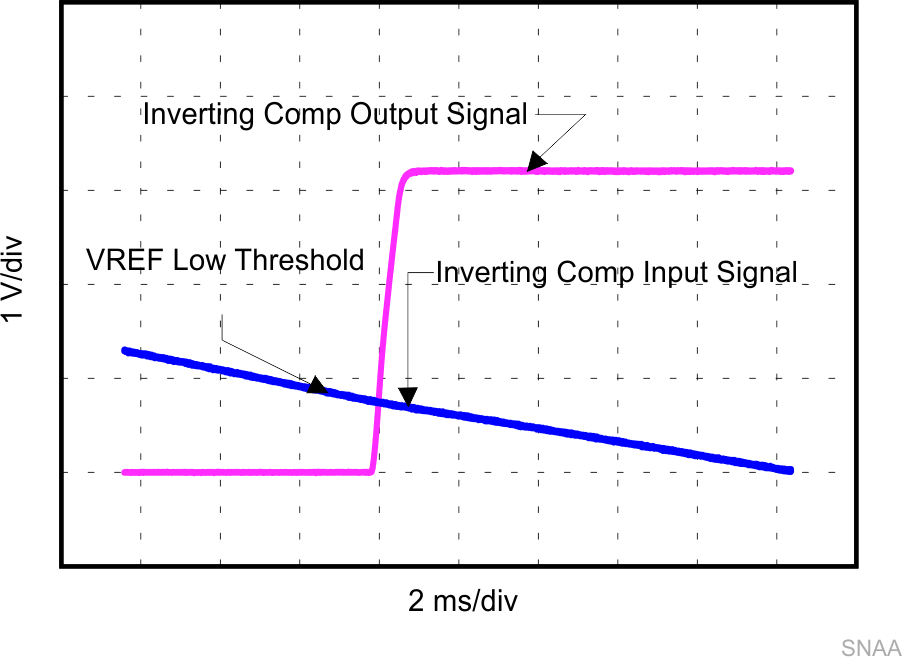
 Referring to Figure 34, the output of the inverting comparator during the lower cycle of the PIR signal switches form the cutoff region to the saturation region as the input signal crosses the VREF_Low threshold.
 Figure 35. Noninverting Comparator Input and Output Signals