SLAA476B February 2011 – July 2019 BQ2040 , BQ2040 , BQ2060A , BQ2060A , BQ2063 , BQ2063 , BQ2083-V1P3 , BQ2083-V1P3 , BQ2084-V143 , BQ2084-V143 , BQ2084-V150 , BQ2084-V150 , BQ2085-V1P3 , BQ2085-V1P3 , BQ20Z40-R1 , BQ20Z40-R1 , BQ20Z70-V160 , BQ20Z70-V160 , BQ20Z80A-V110 , BQ20Z80A-V110 , BQ28400 , BQ28400 , BQ78PL114 , BQ78PL114 , BQ78PL116 , BQ78PL116 , LM5145 , LM5145 , MSP430F5500 , MSP430F5500 , MSP430F5501 , MSP430F5501 , MSP430F5502 , MSP430F5502 , MSP430F5503 , MSP430F5503 , MSP430F5504 , MSP430F5504 , MSP430F5505 , MSP430F5505 , MSP430F5506 , MSP430F5506 , MSP430F5507 , MSP430F5507 , MSP430F5508 , MSP430F5508 , MSP430F5509 , MSP430F5509 , MSP430F5510 , MSP430F5510 , TPS40057 , TPS40057 , TPS40170 , TPS40170
-
Wide-Vin Battery Charger Using SMBus Communication Interface Between MSP430™ MCUs and bq Fuel Gauges
- Trademarks
- 1 Introduction
- 2 Hardware
- 3
Software
- 3.1 SMBus Protocol Description
- 3.2 Software File Structure
- 3.3
API Calls Description
- 3.3.1 UCS_Init ( )
- 3.3.2 Timer_Init ( )
- 3.3.3 PWM_Init ( )
- 3.3.4 ADC_Init ( )
- 3.3.5 Fan_Init ( )
- 3.3.6 LED_Init ( )
- 3.3.7 SMBus_Initialize ( )
- 3.3.8 LED_Control ( )
- 3.3.9 Fan_Control ( )
- 3.3.10 VI_ADC_Read ( )
- 3.3.11 SMBus_Select ( )
- 3.3.12 Calibrate_Battery ( )
- 3.3.13 Delay_Timer ( )
- 3.3.14 PWM_Control ( )
- 3.3.15 Smbus_Access ( )
- 3.3.16 Smbus_Access_PEC ( )
- 3.3.17 crc8MakeBitwise ( )
- 3.4 Sample Application Description
- 4 SBS Supported Commands Using SMBus Protocol
- 5 Detailed Sample Application Flow Chart
- 6 Battery Status Register Description
- 7 MSP430F5510 Daughterboard Schematics
- 8 Setting Up the MSP430F5510 Daughterboard Hardware
- 9 Battery Calibration Circuit Setup
- 10 Battery Voltage and PWM Conversions
- 11 Battery Current and PWM Conversions
- 12 Power Stage Board Schematics (Generation 1: 40-V Input)
- 13 Bode Plot Measurement for Feedback Loop Stability Analysis
- 14 Power Stage Board Schematics (Generation 2: 60-V Input)
- 15 Setting Up the Power Stage Board Hardware
- 16 References
- Revision History
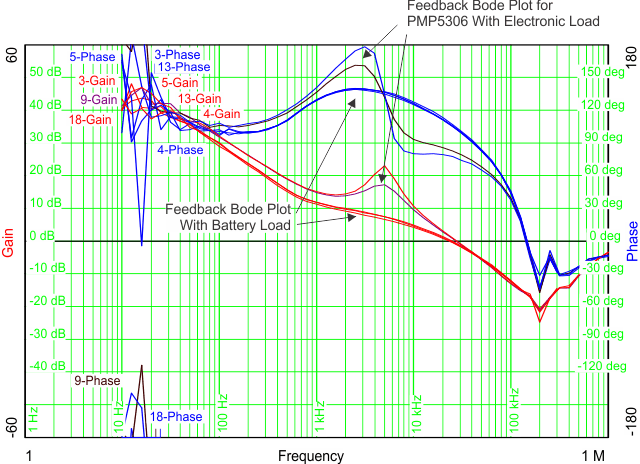
13 Bode Plot Measurement for Feedback Loop Stability Analysis
Figure 16 shows the bode plot measurement for feedback loop stability analysis. The gain is represented on the left side of the phase on the right side of the y-axis.
 Figure 16. Bode Plot Measurement Graph - Gain (left) and Phase (right)